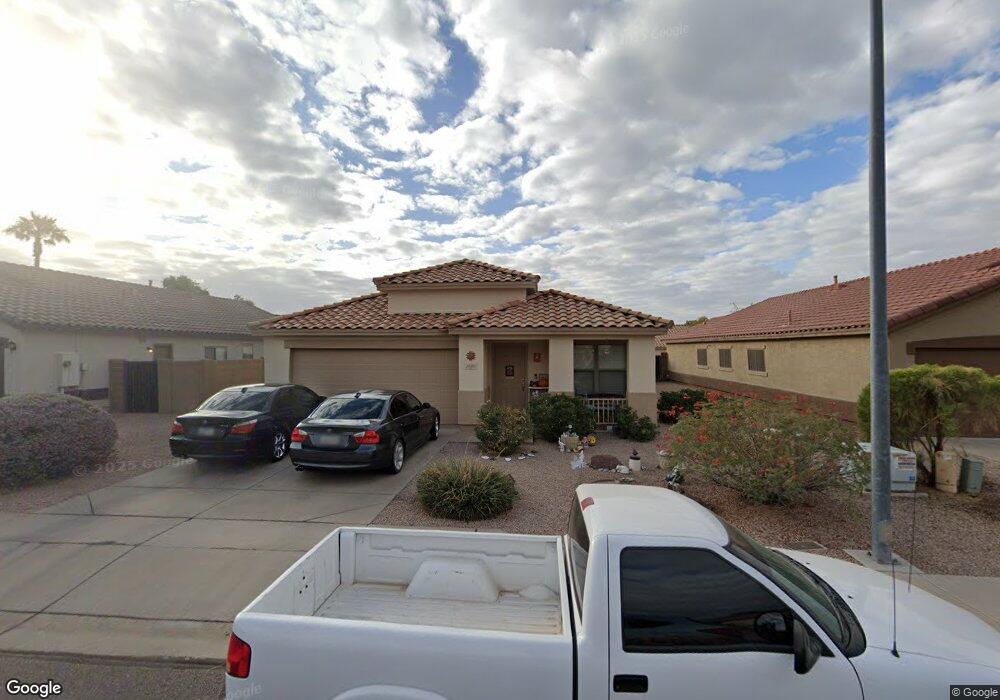
11301 E Quarry Ave Mesa, AZ 85212
Superstition Vistas NeighborhoodEstimated Value: $403,437 - $448,000
Studio
2
Baths
1,918
Sq Ft
$225/Sq Ft
Est. Value
About This Home
This home is located at 11301 E Quarry Ave, Mesa, AZ 85212 and is currently estimated at $431,109, approximately $224 per square foot. 11301 E Quarry Ave is a home located in Maricopa County with nearby schools including Desert Ridge Jr. High School, Desert Ridge High School, and Ala Mesa.
Ownership History
Date
Name
Owned For
Owner Type
Purchase Details
Closed on
Oct 26, 2007
Sold by
Andelich Elaine K and Andelich David K
Bought by
Andelich Elaine K and Andelich David K
Current Estimated Value
Home Financials for this Owner
Home Financials are based on the most recent Mortgage that was taken out on this home.
Original Mortgage
$188,500
Outstanding Balance
$154,264
Interest Rate
6.35%
Mortgage Type
New Conventional
Estimated Equity
$276,845
Purchase Details
Closed on
Jan 15, 2002
Sold by
Kb Home Sales Phoenix Inc
Bought by
Fuller Elaine K
Home Financials for this Owner
Home Financials are based on the most recent Mortgage that was taken out on this home.
Original Mortgage
$134,485
Interest Rate
6.84%
Mortgage Type
FHA
Purchase Details
Closed on
Sep 28, 2001
Sold by
Kb Home Phoenix Inc
Bought by
Kb Home Sales Phoenix Inc and Kaufman & Broad Home Sales Of Az Inc
Create a Home Valuation Report for This Property
The Home Valuation Report is an in-depth analysis detailing your home's value as well as a comparison with similar homes in the area
Home Values in the Area
Average Home Value in this Area
Purchase History
| Date | Buyer | Sale Price | Title Company |
|---|---|---|---|
| Andelich Elaine K | -- | None Available | |
| Fuller Elaine K | $136,596 | First American Title Ins Co | |
| Kb Home Sales Phoenix Inc | -- | First American Title Ins Co |
Source: Public Records
Mortgage History
| Date | Status | Borrower | Loan Amount |
|---|---|---|---|
| Open | Andelich Elaine K | $188,500 | |
| Closed | Fuller Elaine K | $134,485 | |
| Closed | Fuller Elaine K | $8,195 |
Source: Public Records
Tax History
| Year | Tax Paid | Tax Assessment Tax Assessment Total Assessment is a certain percentage of the fair market value that is determined by local assessors to be the total taxable value of land and additions on the property. | Land | Improvement |
|---|---|---|---|---|
| 2025 | $1,437 | $19,397 | -- | -- |
| 2024 | $1,394 | $18,473 | -- | -- |
| 2023 | $1,394 | $35,810 | $7,160 | $28,650 |
| 2022 | $1,360 | $25,900 | $5,180 | $20,720 |
| 2021 | $1,473 | $22,430 | $4,480 | $17,950 |
| 2020 | $1,447 | $21,630 | $4,320 | $17,310 |
| 2019 | $1,341 | $19,380 | $3,870 | $15,510 |
| 2018 | $1,277 | $17,920 | $3,580 | $14,340 |
| 2017 | $1,237 | $16,760 | $3,350 | $13,410 |
| 2016 | $1,283 | $16,230 | $3,240 | $12,990 |
| 2015 | $1,176 | $14,920 | $2,980 | $11,940 |
Source: Public Records
Map
Nearby Homes
- 3549 S Oxley Cir
- 3529 S Tambor Unit 1
- 3541 S Calderon Cir
- 11430 E Pronghorn Ave Unit 3
- 11533 E Quicksilver Ave
- 11223 E Raleigh Ave Unit 3
- 11535 E Persimmon Ave
- 11312 E Prairie Ave
- 11250 E Prairie Ave
- 10903 E Quade Ave
- 11322 E Rembrandt Ave
- 3061 S Elderwood
- 3041 S Lindenwood Cir
- 11417 E Ocaso Ave
- 11208 E Ocaso Ave
- 11227 E Onza Ave
- 11514 E Ocaso Ave
- 11407 E Olla Ave
- 3117 S Signal Butte Rd Unit 484
- 3117 S Signal Butte Rd Unit 540
- 11261 E Quarry Ave
- 11305 E Quarry Ave
- 11255 E Quarry Ave Unit 1
- 11311 E Quarry Ave
- 11306 E Quicksilver Ave
- 11264 E Quicksilver Ave Unit I
- 11312 E Quicksilver Ave
- 11260 E Quicksilver Ave
- 11318 E Quicksilver Ave
- 11317 E Quarry Ave
- 11251 E Quarry Ave
- 11304 E Quarry Ave
- 11310 E Quarry Ave
- 11266 E Quarry Ave
- 11316 E Quarry Ave
- 11256 E Quicksilver Ave
- 11260 E Quarry Ave
- 11324 E Quicksilver Ave
- 11247 E Quarry Ave
- 11322 E Quarry Ave
Your Personal Tour Guide
Ask me questions while you tour the home.