11302 Cherry St Los Alamitos, CA 90720
Estimated Value: $1,371,000 - $1,541,000
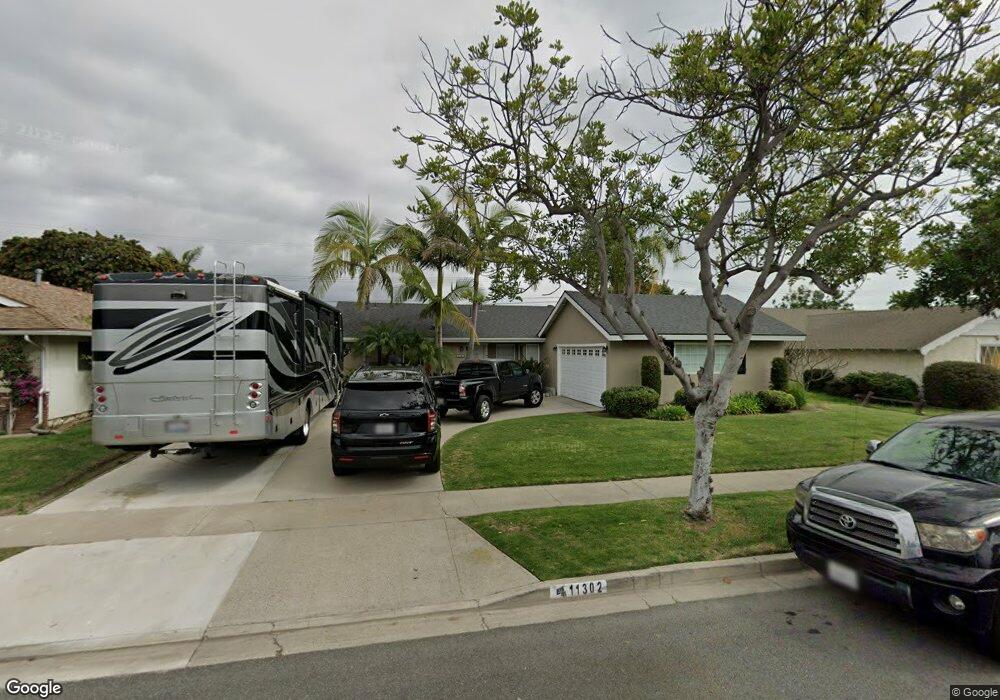
About This Home
This home is located at 11302 Cherry St, Los Alamitos, CA 90720 and is currently estimated at $1,469,642, approximately $838 per square foot. 11302 Cherry St is a home located in Orange County with nearby schools including Rossmoor Elementary School, Jack L. Weaver Elementary School, and Oak Middle School.
Ownership History
We collect this data history from publicly available records. To have your information removed, we recommend requesting removal directly through your county’s website.
Purchase Details
Purchase Details
Purchase Details
Purchase Details
Home Financials for this Owner
Home Financials are based on the most recent Mortgage that was taken out on this home.Home Values in the Area
Average Home Value in this Area
Purchase History
We collect this data history from publicly available records. To have your information removed, we recommend requesting removal directly through your county’s website.
| Date | Buyer | Sale Price | Title Company |
|---|---|---|---|
| -- | None Listed On Document | ||
| -- | None Available | ||
| -- | None Available | ||
| $265,000 | North American Title Co | ||
| -- | California Counties Title Co |
Mortgage History
We collect this data history from publicly available records. To have your information removed, we recommend requesting removal directly through your county’s website.
| Date | Status | Borrower | Loan Amount |
|---|---|---|---|
| Previous Owner | $201,500 |
Tax History
We collect this data history from publicly available records. To have your information removed, we recommend requesting removal directly through your county’s website.
| Year | Tax Paid | Tax Assessment Tax Assessment Total Assessment is a certain percentage of the fair market value that is determined by local assessors to be the total taxable value of land and additions on the property. | Land | Improvement |
|---|---|---|---|---|
| 2025 | $5,226 | $423,132 | $324,589 | $98,543 |
| 2024 | $5,226 | $414,836 | $318,225 | $96,611 |
| 2023 | $5,103 | $406,702 | $311,985 | $94,717 |
| 2022 | $5,074 | $398,728 | $305,868 | $92,860 |
| 2021 | $4,964 | $390,910 | $299,870 | $91,040 |
| 2020 | $4,973 | $386,902 | $296,795 | $90,107 |
| 2019 | $4,798 | $379,316 | $290,975 | $88,341 |
| 2018 | $4,573 | $371,879 | $285,270 | $86,609 |
| 2017 | $4,475 | $364,588 | $279,677 | $84,911 |
| 2016 | $4,389 | $357,440 | $274,193 | $83,247 |
| 2015 | $4,336 | $352,071 | $270,074 | $81,997 |
| 2014 | $4,187 | $345,175 | $264,784 | $80,391 |
Map
- 3845 Farquhar Ave Unit 110
- 3845 Farquhar Ave Unit 309
- 3721 La Colmena Way
- 3682 La Colmena Way
- 10901 Chestnut St
- 11782 Davenport Rd
- 10921 Walnut St
- 11831 Paseo Bonita
- 3262 Ruth Elaine Dr
- 11872 Reagan St
- 10861 Walnut St
- 4302 Howard Ave
- 3142 Quail Run Rd
- 4411 Farquhar Ave
- 10511 Sausalito Ct
- 12041 Davenport Rd
- 10681 Oak St Unit 89
- 10681 Oak St Unit 58
- 3001 Coleridge Dr
- 11582 Foster Rd
- 11312 Cherry St
- 11292 Cherry St
- 11332 Cherry St
- 11272 Cherry St
- 11303 Rochelle St
- 11313 Rochelle St
- 11301 Cherry St
- 11293 Rochelle St
- 11291 Cherry St
- 11311 Cherry St
- 11333 Rochelle St
- 11273 Rochelle St
- 11271 Cherry St
- 11342 Cherry St
- 11262 Cherry St
- 11331 Cherry St
- 11343 Rochelle St
- 11263 Rochelle St
- 11302 Reagan St
- 11261 Cherry St
Ask me questions while you tour the home.