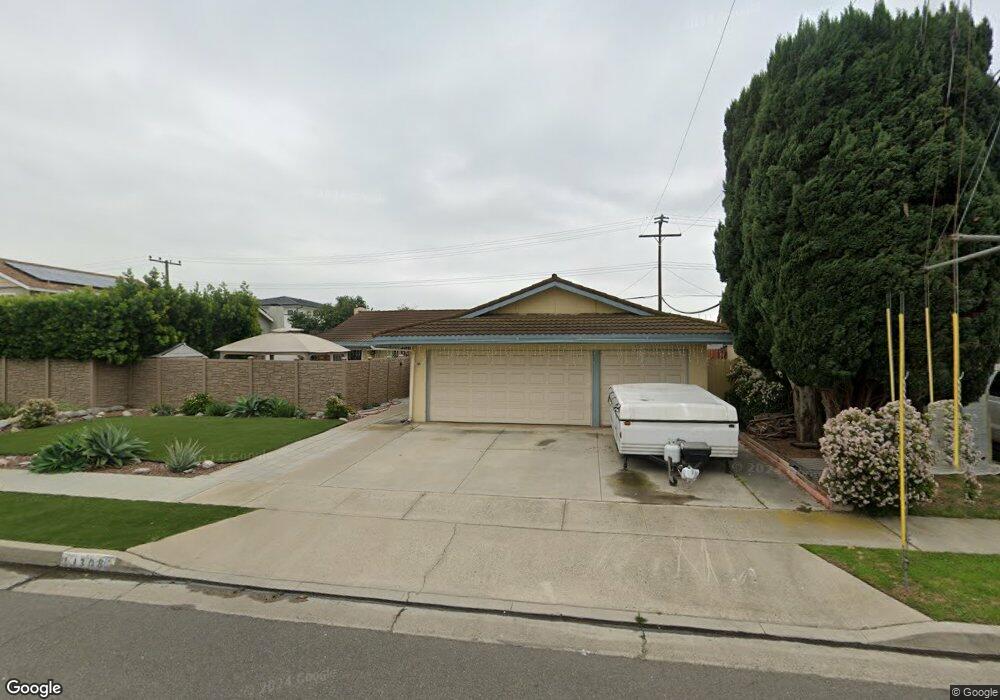
11308 Snowdrop Ave Fountain Valley, CA 92708
Estimated Value: $1,160,861 - $1,374,000
4
Beds
2
Baths
1,673
Sq Ft
$757/Sq Ft
Est. Value
About This Home
This home is located at 11308 Snowdrop Ave, Fountain Valley, CA 92708 and is currently estimated at $1,266,465, approximately $757 per square foot. 11308 Snowdrop Ave is a home located in Orange County with nearby schools including Mamie L. Northcutt Elementary School, Fitz Intermediate Language Academy, and Los Amigos High School.
Ownership History
Date
Name
Owned For
Owner Type
Purchase Details
Closed on
Apr 12, 2006
Sold by
Nguyen Tam Chanh
Bought by
Nguyen Tam Chanh and Tran Julie Kim
Current Estimated Value
Purchase Details
Closed on
Apr 25, 2005
Sold by
Tran Julie Kim
Bought by
Nguyen Tam Chanh
Purchase Details
Closed on
Apr 12, 2001
Sold by
Nguyen Tam Chanh and Tran Julie Kim
Bought by
Nguyen Tam Chanh
Purchase Details
Closed on
Apr 10, 2001
Sold by
Nguyen Kiem Tri and Nguyen Tho Thi
Bought by
Nguyen Tam Chanh
Purchase Details
Closed on
Mar 29, 2001
Sold by
Nguyen John Quyet Tu
Bought by
Nguyen Tam Chanh
Purchase Details
Closed on
Dec 22, 1995
Sold by
Nguyen Kiem Tri and Nguyen Tho Thi
Bought by
Nguyen Kiem Tri and Nguyen Tho Thi
Create a Home Valuation Report for This Property
The Home Valuation Report is an in-depth analysis detailing your home's value as well as a comparison with similar homes in the area
Home Values in the Area
Average Home Value in this Area
Purchase History
| Date | Buyer | Sale Price | Title Company |
|---|---|---|---|
| Nguyen Tam Chanh | -- | None Available | |
| Nguyen Tam Chanh | -- | Landamerica Southland Title | |
| Nguyen Tam Chanh | -- | Landamerica Southland Title | |
| Nguyen Tam Chanh | -- | Orange Coast Title Company | |
| Nguyen Tam Chanh | -- | Orange Coast Title Company | |
| Nguyen Tam Chanh | -- | -- | |
| Nguyen Kiem Tri | -- | -- |
Source: Public Records
Tax History Compared to Growth
Tax History
| Year | Tax Paid | Tax Assessment Tax Assessment Total Assessment is a certain percentage of the fair market value that is determined by local assessors to be the total taxable value of land and additions on the property. | Land | Improvement |
|---|---|---|---|---|
| 2025 | $5,439 | $476,561 | $357,779 | $118,782 |
| 2024 | $5,439 | $467,217 | $350,764 | $116,453 |
| 2023 | $5,337 | $458,056 | $343,886 | $114,170 |
| 2022 | $5,220 | $449,075 | $337,143 | $111,932 |
| 2021 | $5,167 | $440,270 | $330,532 | $109,738 |
| 2020 | $5,096 | $435,756 | $327,143 | $108,613 |
| 2019 | $4,997 | $427,212 | $320,728 | $106,484 |
| 2018 | $4,895 | $418,836 | $314,439 | $104,397 |
| 2017 | $4,828 | $410,624 | $308,274 | $102,350 |
| 2016 | $4,616 | $402,573 | $302,229 | $100,344 |
| 2015 | $4,551 | $396,526 | $297,689 | $98,837 |
| 2014 | $4,437 | $388,759 | $291,858 | $96,901 |
Source: Public Records
Map
Nearby Homes
- 11325 Dewdrop Ave
- 11106 Coral Aloe Ave
- 11356 Stonecress Ave
- 11611 Rosemary Ave
- 12062 W Edinger Ave Unit 19
- 10744 Lehnhardt Ave
- 12061 Brighton River Unit 37
- 11620 Warner Ave Unit 624
- 11892 Geode Ave
- 12143 Sylvan River Unit 147
- 17168 Newhope St Unit 222
- 17077 Los Modelos St
- 17200 Newhope St Unit 109
- 17200 Newhope St Unit 217
- 17200 Newhope St Unit 10
- 17200 Newhope St Unit 1
- 17200 Newhope St Unit 312
- 17230 San Lorenzo Cir
- 4512 W Watkins Way
- 605 S Mountain View St
- 11322 Snowdrop Ave
- 11296 Snowdrop Ave
- 16401 Mount Ararat Cir
- 11336 Snowdrop Ave
- 11282 Snowdrop Ave
- 16339 Farnham St
- 16407 Mount Ararat Cir
- 16400 Mount Ararat Cir
- 11293 Topaz Ave
- 16338 Livingstone St
- 16406 Mount Dunhaven St
- 11350 Snowdrop Ave
- 11270 Snowdrop Ave
- 11337 Snowdrop Ave
- 16323 Farnham St
- 16408 Mount Ararat Cir
- 11279 Topaz Ave
- 16415 Mount Ararat Cir
- 16320 Livingstone St
- 11351 Snowdrop Ave