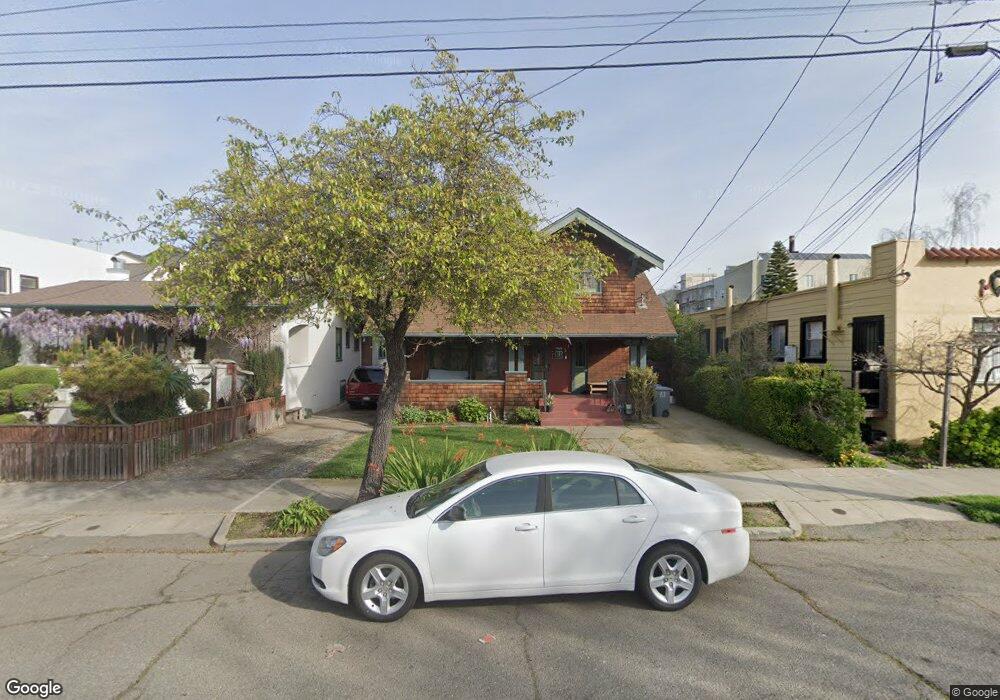
1131 Addison St Berkeley, CA 94702
West Berkeley NeighborhoodEstimated Value: $1,243,000 - $1,688,000
4
Beds
2
Baths
1,774
Sq Ft
$807/Sq Ft
Est. Value
About This Home
This home is located at 1131 Addison St, Berkeley, CA 94702 and is currently estimated at $1,431,091, approximately $806 per square foot. 1131 Addison St is a home located in Alameda County with nearby schools including Rosa Parks Elementary School, Ruth Acty Elementary, and Berkeley Arts Magnet at Whittier School.
Ownership History
Date
Name
Owned For
Owner Type
Purchase Details
Closed on
Nov 19, 2010
Sold by
Irvin Andrea
Bought by
Irvin Andrea and Andrea E Irvin Revocable Trust
Current Estimated Value
Purchase Details
Closed on
Jul 29, 2004
Sold by
Ageno Barbara J and Watts Jimmy
Bought by
Irvin Andrea
Home Financials for this Owner
Home Financials are based on the most recent Mortgage that was taken out on this home.
Original Mortgage
$500,000
Outstanding Balance
$250,737
Interest Rate
6.17%
Mortgage Type
Purchase Money Mortgage
Estimated Equity
$1,180,354
Purchase Details
Closed on
Oct 8, 2003
Sold by
Connors Mervin J and Mervin J Connors 2003 Trust
Bought by
Dildy Judith Ann and Dildy Brian
Purchase Details
Closed on
Jun 24, 2003
Sold by
Tuft Margaret A and Holtz Marilyn Tuft
Bought by
Tuft Margaret A and Holtz Marilyn Tuft
Purchase Details
Closed on
Feb 25, 2003
Sold by
Connors Mervin J
Bought by
Connors Mervin J and Mervin J Connors 2003 Trust
Purchase Details
Closed on
Sep 20, 1993
Sold by
Scarsi Ada C
Bought by
Scarsi Ada C and The Ada C Scarsi 1991 Trust
Create a Home Valuation Report for This Property
The Home Valuation Report is an in-depth analysis detailing your home's value as well as a comparison with similar homes in the area
Home Values in the Area
Average Home Value in this Area
Purchase History
| Date | Buyer | Sale Price | Title Company |
|---|---|---|---|
| Irvin Andrea | -- | None Available | |
| Irvin Andrea | $625,000 | Placer Title Company | |
| Dildy Judith Ann | -- | -- | |
| Tuft Margaret A | -- | -- | |
| Connors Mervin J | -- | -- | |
| Scarsi Ada C | -- | -- |
Source: Public Records
Mortgage History
| Date | Status | Borrower | Loan Amount |
|---|---|---|---|
| Open | Irvin Andrea | $500,000 |
Source: Public Records
Tax History
| Year | Tax Paid | Tax Assessment Tax Assessment Total Assessment is a certain percentage of the fair market value that is determined by local assessors to be the total taxable value of land and additions on the property. | Land | Improvement |
|---|---|---|---|---|
| 2025 | $14,351 | $873,663 | $261,333 | $619,330 |
| 2024 | $14,351 | $856,401 | $256,211 | $607,190 |
| 2023 | $13,988 | $846,474 | $251,188 | $595,286 |
| 2022 | $13,667 | $822,881 | $246,264 | $583,617 |
| 2021 | $13,692 | $806,611 | $241,436 | $572,175 |
| 2020 | $12,972 | $805,271 | $238,961 | $566,310 |
| 2019 | $12,467 | $789,487 | $234,277 | $555,210 |
| 2018 | $12,241 | $774,012 | $229,685 | $544,327 |
| 2017 | $11,814 | $758,841 | $225,183 | $533,658 |
| 2016 | $11,425 | $743,968 | $220,770 | $523,198 |
| 2015 | $11,263 | $732,797 | $217,455 | $515,342 |
| 2014 | $11,120 | $718,447 | $213,196 | $505,251 |
Source: Public Records
Map
Nearby Homes
- 1919 Curtis St
- 2144 Curtis St
- 2013 9th St
- 1128 Delaware St
- 1261 Hearst Ave
- 2231 Byron St
- 1728 Curtis St
- 2241 Ninth St
- 940 Delaware St
- 2324 Browning St
- 2327 10th St Unit 4
- 931 Bancroft Way
- 1050 Allston Way
- 1039 Channing Way
- 1322 Virginia St
- 2220 7th St
- 1411 Hearst Ave Unit 2
- 1631 Belvedere Ave
- 2238 7th St
- 995 Virginia St
- 1127 Addison St
- 1135 Addison St
- 1121 Addison St
- 1141 Addison St
- 1143 Addison St
- 1120 Addison St
- 1176 University Ave
- 1124 Addison St
- 2107 Byron St
- 1145 Addison St
- 1134 Addison St
- 1136 Addison St
- 1114 Addison St
- 1122 University Ave
- 1122 University Ave
- 1138 Addison St
- 1112 Addison St
- 1110 University Ave
- 2108 Byron St
- 2109 Byron St
Your Personal Tour Guide
Ask me questions while you tour the home.