Estimated Value: $1,326,100 - $1,691,000
2
Beds
2
Baths
1,900
Sq Ft
$799/Sq Ft
Est. Value
About This Home
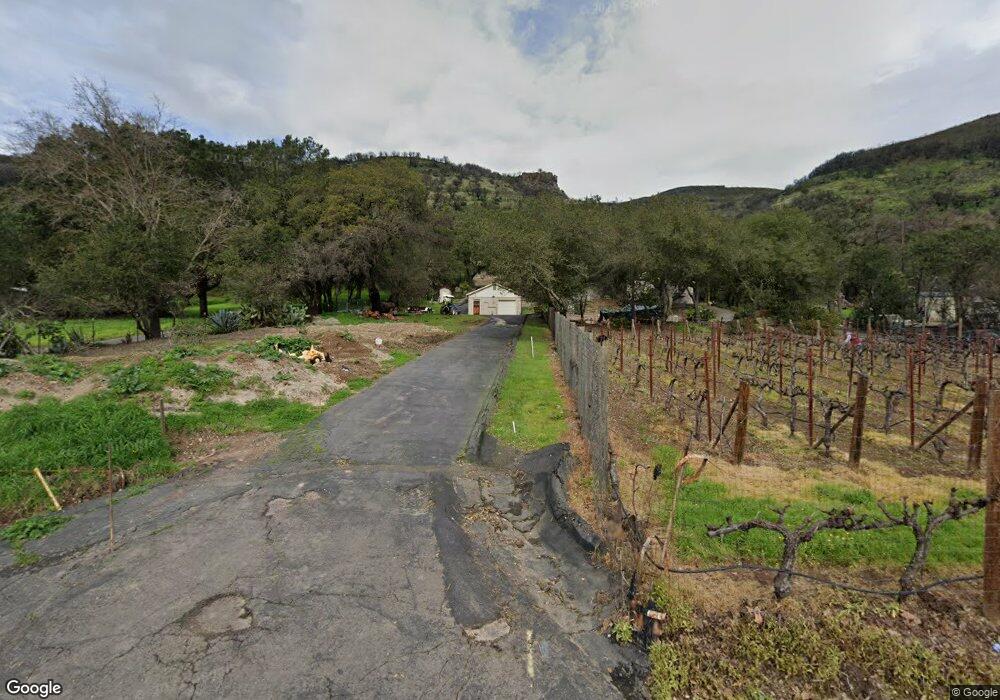
This home is located at 1131 Mount George Ave, Napa, CA 94558 and is currently estimated at $1,517,275, approximately $798 per square foot. 1131 Mount George Ave is a home located in Napa County with nearby schools including Vichy Elementary School, Silverado Middle School, and Vintage High School.
Ownership History
Date
Name
Owned For
Owner Type
Purchase Details
Closed on
Dec 16, 2019
Sold by
Freitas Jedidiah A and Freitas Kristin M Takemoto
Bought by
Freitas Jedidiah A and Takemoto Kristin M
Current Estimated Value
Home Financials for this Owner
Home Financials are based on the most recent Mortgage that was taken out on this home.
Original Mortgage
$492,826
Outstanding Balance
$431,899
Interest Rate
3.3%
Mortgage Type
FHA
Estimated Equity
$1,085,376
Purchase Details
Closed on
Jun 25, 2012
Sold by
Whitehair Alice Jane and The Elmer Vincent Whitehair &
Bought by
Freitas Jedidiah A and Takemoto Kristin M
Home Financials for this Owner
Home Financials are based on the most recent Mortgage that was taken out on this home.
Original Mortgage
$488,000
Interest Rate
3.74%
Mortgage Type
New Conventional
Purchase Details
Closed on
Mar 7, 1997
Sold by
Jane Whitehair Elmer V and Jane Alice
Bought by
Whitehair Elmer Vincent and Whitehair Alice Jane
Create a Home Valuation Report for This Property
The Home Valuation Report is an in-depth analysis detailing your home's value as well as a comparison with similar homes in the area
Home Values in the Area
Average Home Value in this Area
Purchase History
| Date | Buyer | Sale Price | Title Company |
|---|---|---|---|
| Freitas Jedidiah A | -- | Pacific Coast Title Company | |
| Freitas Jedidiah A | $610,000 | Old Republic Title Company | |
| Whitehair Elmer Vincent | -- | Napa Land Title Co |
Source: Public Records
Mortgage History
| Date | Status | Borrower | Loan Amount |
|---|---|---|---|
| Open | Freitas Jedidiah A | $492,826 | |
| Closed | Freitas Jedidiah A | $488,000 |
Source: Public Records
Tax History Compared to Growth
Tax History
| Year | Tax Paid | Tax Assessment Tax Assessment Total Assessment is a certain percentage of the fair market value that is determined by local assessors to be the total taxable value of land and additions on the property. | Land | Improvement |
|---|---|---|---|---|
| 2025 | $8,280 | $766,182 | $345,408 | $420,774 |
| 2024 | $8,280 | $751,160 | $338,636 | $412,524 |
| 2023 | $8,280 | $736,433 | $331,997 | $404,436 |
| 2022 | $8,010 | $721,994 | $325,488 | $396,506 |
| 2021 | $7,889 | $707,838 | $319,106 | $388,732 |
| 2020 | $7,827 | $700,581 | $315,834 | $384,747 |
| 2019 | $7,681 | $686,845 | $309,642 | $377,203 |
| 2018 | $7,608 | $673,378 | $303,571 | $369,807 |
| 2017 | $7,487 | $660,175 | $297,619 | $362,556 |
| 2016 | $7,416 | $647,232 | $291,784 | $355,448 |
| 2015 | $6,982 | $637,511 | $287,402 | $350,109 |
| 2014 | $6,884 | $625,024 | $281,773 | $343,251 |
Source: Public Records
Map
Nearby Homes
- 1114 Mount George Ave
- 1101 Olive Hill Ln
- 1111 Olive Hill Ln
- 2870 Monticello Rd
- 1057 La Grande Ave
- 3120 Vichy Ave
- 3180 Vichy Ave
- 2143 Monticello Rd
- 2277 Monticello Rd
- 3000 Hagen Rd
- 2060 Hagen Rd
- 2846 Monticello Rd
- 2152 Monticello Rd
- 2134 Monticello Rd
- 2723 Monticello Rd
- 2186 Monticello Rd
- 2015 Monticello Rd
- 2205 Loma Heights Rd
- 2297 1st Ave
- 1776 Monticello Rd
- 1125 Mount George Ave
- 1141 Mount George Ave
- 1121 Mount George Ave
- 1111 Mount George Ave
- 1138 Mount George Ave
- 1134 Mount George Ave
- 1130 Mount George Ave
- 1147 Mount George Ave
- 1113 Mount George Ave
- 1144 Mount George Ave
- 1135 Mount George Ave
- 1090A Mt George Ave
- 1090 Mount George Ave
- 1150 Mount George Ave
- 1115 Mount George Ave
- 1151 Mount George Ave
- 1100 Mount George Ave
- 1117 Mount George Ave
- 1119 Mount George Ave
- 1096 Mount George Ave