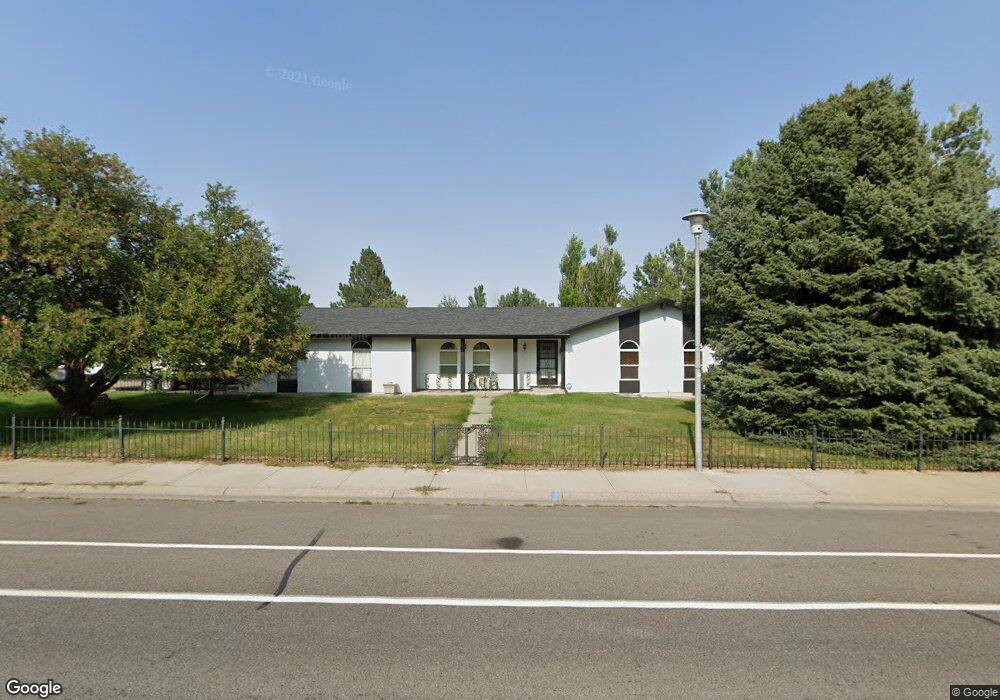
1131 Nutter Blvd Billings, MT 59105
Billings Heights NeighborhoodEstimated Value: $410,000 - $458,221
4
Beds
3
Baths
3,344
Sq Ft
$130/Sq Ft
Est. Value
About This Home
This home is located at 1131 Nutter Blvd, Billings, MT 59105 and is currently estimated at $436,055, approximately $130 per square foot. 1131 Nutter Blvd is a home located in Yellowstone County with nearby schools including Sandstone School, Castle Rock Junior High School, and Skyview High School.
Ownership History
Date
Name
Owned For
Owner Type
Purchase Details
Closed on
Sep 8, 2017
Sold by
Shaw Matthew D and Shaw Jennifer D
Bought by
Geertz Daniel
Current Estimated Value
Home Financials for this Owner
Home Financials are based on the most recent Mortgage that was taken out on this home.
Original Mortgage
$233,100
Outstanding Balance
$194,603
Interest Rate
3.89%
Mortgage Type
New Conventional
Estimated Equity
$241,452
Purchase Details
Closed on
Dec 16, 2016
Sold by
Stevenson Ron and Stevenson Kaye
Bought by
Shaw Matthew D and Shaw Jennifer D
Home Financials for this Owner
Home Financials are based on the most recent Mortgage that was taken out on this home.
Original Mortgage
$237,109
Interest Rate
3.94%
Mortgage Type
VA
Purchase Details
Closed on
May 7, 2015
Sold by
Thacker Lois S and Vandenberg Joan
Bought by
Stevenson Ron and Stevenson Kaye
Purchase Details
Closed on
Aug 1, 2006
Sold by
Thacker Lois S
Bought by
Thacker Lois S and Vandenberg Joan
Create a Home Valuation Report for This Property
The Home Valuation Report is an in-depth analysis detailing your home's value as well as a comparison with similar homes in the area
Home Values in the Area
Average Home Value in this Area
Purchase History
| Date | Buyer | Sale Price | Title Company |
|---|---|---|---|
| Geertz Daniel | -- | American Title & Escrow | |
| Shaw Matthew D | -- | Stewart Title | |
| Stevenson Ron | -- | Stewart Title | |
| Thacker Lois S | -- | None Available |
Source: Public Records
Mortgage History
| Date | Status | Borrower | Loan Amount |
|---|---|---|---|
| Open | Geertz Daniel | $233,100 | |
| Previous Owner | Shaw Matthew D | $237,109 |
Source: Public Records
Tax History
| Year | Tax Paid | Tax Assessment Tax Assessment Total Assessment is a certain percentage of the fair market value that is determined by local assessors to be the total taxable value of land and additions on the property. | Land | Improvement |
|---|---|---|---|---|
| 2025 | $4,247 | $484,000 | $67,826 | $416,174 |
| 2024 | $4,247 | $425,300 | $65,499 | $359,801 |
| 2023 | $4,248 | $425,300 | $65,499 | $359,801 |
| 2022 | $2,743 | $290,500 | $0 | $0 |
| 2021 | $3,190 | $290,500 | $0 | $0 |
| 2020 | $3,148 | $273,700 | $0 | $0 |
| 2019 | $3,010 | $273,700 | $0 | $0 |
| 2018 | $2,723 | $239,900 | $0 | $0 |
| 2017 | $2,651 | $239,900 | $0 | $0 |
| 2016 | $2,508 | $228,800 | $0 | $0 |
| 2015 | $2,448 | $228,100 | $0 | $0 |
| 2014 | $2,145 | $104,728 | $0 | $0 |
Source: Public Records
Map
Nearby Homes
- 1320 Mineral Place Unit 2
- 1152 Toole Ct
- 1322 Babcock Cir
- 0 Easy St
- 1224 Watson Peak Rd
- 914 Aronson Ave
- 1017 Toole Cir
- 1239 Watson Peak Rd
- 373 Stewart Ct S
- 1315 Watson Peak Rd
- 126 Erickson Ct N
- 52 Prince of Wales Dr
- 2011 Gleneagles Blvd
- 2059 Gleneagles Blvd
- 2027 Gleneagles Blvd
- 2019 Gleneagles Blvd
- 2067 Gleneagles Blvd
- 1127 Patriot St
- 1168 Minuteman St
- 212 Tam Oshanter Rd
- 1221 Lonesome Pine Ln
- 1121 Nutter Blvd
- 1208 Claim Jumper Ln
- 1114 Nutter Blvd
- 1231 Lonesome Pine Ln
- 1210 Lonesome Pine Ln
- 1118 Nutter Blvd
- 1110 Nutter Blvd
- 1220 Lonesome Pine Ln
- 1216 Claim Jumper Ln
- 1122 Nutter Blvd
- 1106 Nutter Blvd
- 1241 Lonesome Pine Ln
- 1101 Nutter Blvd
- 1222 Claim Jumper Ln
- 213 Ashley Ct N
- 1126 Nutter Blvd
- 217 Ashley Ct N
- 209 Ashley Ct N
- 1211 Claim Jumper Ln
Your Personal Tour Guide
Ask me questions while you tour the home.