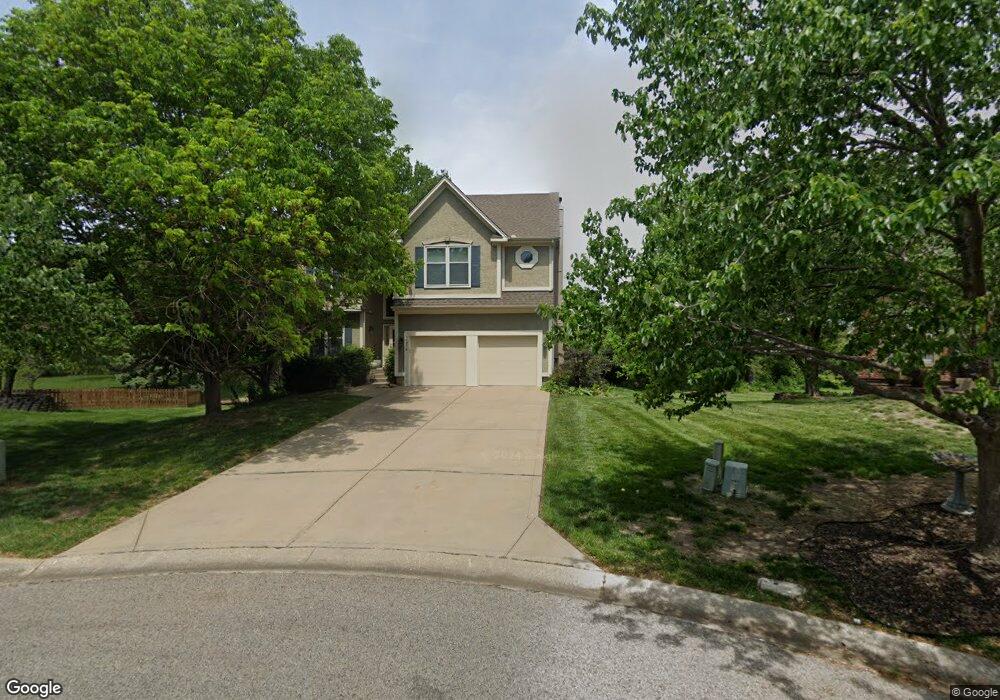
11314 Acuff Ln Lenexa, KS 66215
Estimated Value: $488,000 - $523,705
4
Beds
4
Baths
2,532
Sq Ft
$198/Sq Ft
Est. Value
About This Home
This home is located at 11314 Acuff Ln, Lenexa, KS 66215 and is currently estimated at $500,426, approximately $197 per square foot. 11314 Acuff Ln is a home located in Johnson County with nearby schools including Walnut Grove Elementary School, Pioneer Trail Middle School, and Olathe East Sr High School.
Ownership History
Date
Name
Owned For
Owner Type
Purchase Details
Closed on
Dec 14, 2017
Sold by
Mclewin Scott
Bought by
Mclewin Scott and Mclewin Christina
Current Estimated Value
Purchase Details
Closed on
Nov 22, 2013
Sold by
Paul Mclewin Melanie A
Bought by
Mclewin Scott M
Create a Home Valuation Report for This Property
The Home Valuation Report is an in-depth analysis detailing your home's value as well as a comparison with similar homes in the area
Home Values in the Area
Average Home Value in this Area
Purchase History
| Date | Buyer | Sale Price | Title Company |
|---|---|---|---|
| Mclewin Scott | -- | None Available | |
| Mclewin Scott M | -- | None Available |
Source: Public Records
Tax History
| Year | Tax Paid | Tax Assessment Tax Assessment Total Assessment is a certain percentage of the fair market value that is determined by local assessors to be the total taxable value of land and additions on the property. | Land | Improvement |
|---|---|---|---|---|
| 2025 | $6,098 | $51,543 | $11,655 | $39,888 |
| 2023 | $5,730 | $45,759 | $9,635 | $36,124 |
| 2022 | $5,018 | $39,066 | $8,754 | $30,312 |
| 2021 | $5,176 | $38,284 | $7,956 | $30,328 |
| 2020 | $5,009 | $36,674 | $7,956 | $28,718 |
| 2019 | $4,854 | $35,271 | $6,921 | $28,350 |
| 2018 | $4,767 | $34,247 | $6,921 | $27,326 |
| 2017 | $4,415 | $31,004 | $6,017 | $24,987 |
| 2016 | $4,117 | $29,555 | $6,017 | $23,538 |
| 2015 | $3,894 | $27,933 | $6,019 | $21,914 |
| 2013 | -- | $26,876 | $5,733 | $21,143 |
Source: Public Records
Map
Nearby Homes
- 14202 W 115th St
- 14418 W 115th Terrace
- 14083 W 112th Terrace
- 14036 W 113th St
- 14028 W 113th St
- 14004 W 113th St
- 13952 W 115th St
- 11274 S Pflumm Rd
- 11388 S Pflumm Rd
- 11813 S Hallet St
- 11812 S Carriage Rd
- 11512 Noland St
- 13981 W 120th St
- 12844 W 110th Terrace
- 11931 S Rene St
- 12786 W 110th Terrace
- 12722 W 110th Terrace
- 10907 Gillette St
- 10952 Bradshaw St
- 10902 Bradshaw St
- 11318 Acuff Ln
- 11313 Acuff Ln
- 11317 Acuff Ln
- 11322 Acuff Ln
- 11314 Mullen Rd
- 11326 Acuff Ln
- 11319 Acuff Ln
- 11310 Mullen Rd
- 11320 Mullen Rd
- 11325 Acuff Ln
- 14510 W 114th St
- 11330 Acuff Ln
- 11324 Mullen Rd
- 11402 Oakview Dr
- 11328 Mullen Rd
- 11311 Mullen Rd
- 11408 Oakview Dr
- 11332 Mullen Rd
- 11402 Acuff Ln
- 11315 Mullen Rd
Your Personal Tour Guide
Ask me questions while you tour the home.