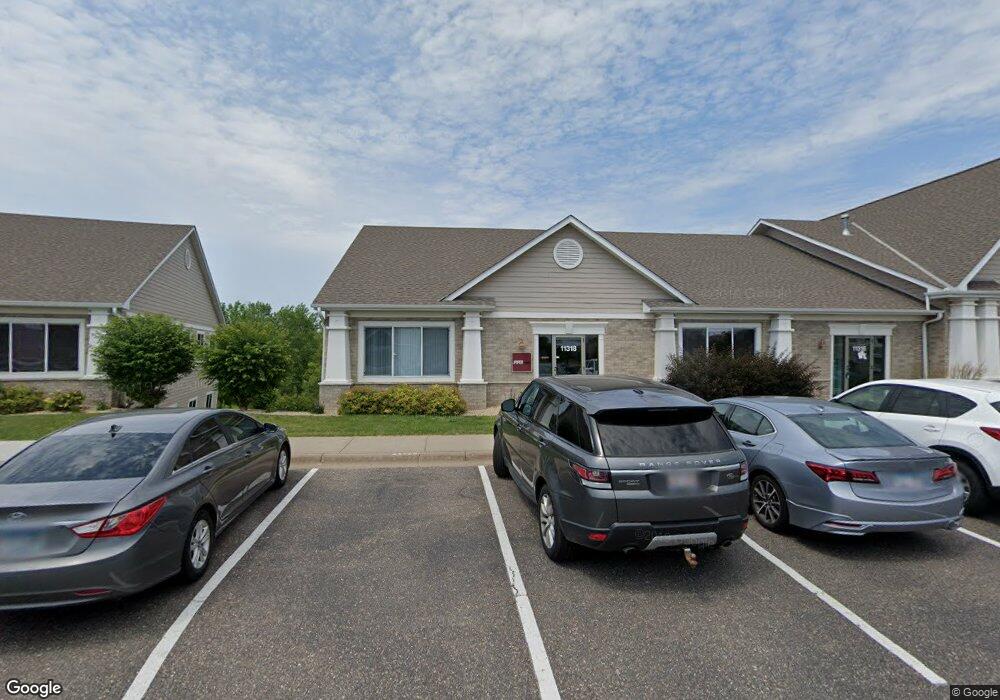
11318 86th Ave N Unit Main floor Maple Grove, MN 55369
Estimated Value: $1,037,487
--
Bed
--
Bath
6,400
Sq Ft
$162/Sq Ft
Est. Value
About This Home
This home is located at 11318 86th Ave N Unit Main floor, Maple Grove, MN 55369 and is currently estimated at $1,037,487, approximately $162 per square foot. 11318 86th Ave N Unit Main floor is a home located in Hennepin County with nearby schools including Rice Lake Elementary School, Maple Grove Middle School, and Maple Grove Senior High School.
Ownership History
Date
Name
Owned For
Owner Type
Purchase Details
Closed on
Aug 30, 2019
Sold by
Msks Properties Llc
Bought by
Moon Hill Holdings Too Llc
Current Estimated Value
Home Financials for this Owner
Home Financials are based on the most recent Mortgage that was taken out on this home.
Original Mortgage
$344,000
Interest Rate
3.09%
Mortgage Type
New Conventional
Purchase Details
Closed on
Nov 18, 2016
Sold by
Team Vision Llc
Bought by
Msks Properties Llc
Home Financials for this Owner
Home Financials are based on the most recent Mortgage that was taken out on this home.
Original Mortgage
$507,000
Interest Rate
3.47%
Mortgage Type
Future Advance Clause Open End Mortgage
Purchase Details
Closed on
Dec 30, 2010
Sold by
River City Building Management Llc
Bought by
Peterson Blaine M and Bonine Peterson Barbara J
Purchase Details
Closed on
May 27, 2004
Sold by
Klingelhutz Development Co
Bought by
River City Building Management Llc
Create a Home Valuation Report for This Property
The Home Valuation Report is an in-depth analysis detailing your home's value as well as a comparison with similar homes in the area
Home Values in the Area
Average Home Value in this Area
Purchase History
| Date | Buyer | Sale Price | Title Company |
|---|---|---|---|
| Moon Hill Holdings Too Llc | $775,000 | Land Title Inc | |
| Msks Properties Llc | $676,000 | Guaranty Commercial Title In | |
| Peterson Blaine M | $400,000 | -- | |
| River City Building Management Llc | $878,138 | -- |
Source: Public Records
Mortgage History
| Date | Status | Borrower | Loan Amount |
|---|---|---|---|
| Closed | Moon Hill Holdings Too Llc | $344,000 | |
| Closed | Moon Hill Holdings Too Llc | $430,000 | |
| Previous Owner | Msks Properties Llc | $507,000 |
Source: Public Records
Tax History Compared to Growth
Tax History
| Year | Tax Paid | Tax Assessment Tax Assessment Total Assessment is a certain percentage of the fair market value that is determined by local assessors to be the total taxable value of land and additions on the property. | Land | Improvement |
|---|---|---|---|---|
| 2024 | $28,802 | $1,025,100 | $105,000 | $920,100 |
| 2023 | $28,024 | $1,027,100 | $105,000 | $922,100 |
| 2022 | $24,561 | $877,600 | $105,000 | $772,600 |
| 2021 | $23,626 | $819,400 | $105,000 | $714,400 |
| 2020 | $23,167 | $777,300 | $105,000 | $672,300 |
| 2019 | $22,722 | $733,700 | $105,000 | $628,700 |
| 2018 | $21,507 | $687,100 | $105,000 | $582,100 |
| 2017 | $22,278 | $621,400 | $105,000 | $516,400 |
| 2016 | $22,843 | $621,400 | $105,000 | $516,400 |
| 2015 | $23,871 | $621,400 | $105,000 | $516,400 |
| 2014 | -- | $587,600 | $105,000 | $482,600 |
Source: Public Records
Map
Nearby Homes
- 8361 Arrowwood Ln N
- 11712 84th Ave N Unit 309
- 8704 Cottonwood Ln N
- 8764 Cottonwood Ln N
- 11879 85th Place N Unit 54
- 11537 88th Ave N
- 11631 88th Ave N
- 8406 Jonquil Ln N
- 8864 Cottonwood Ln N
- 11601 82nd Ave N
- 11486 81st Place N
- 11540 81st Place N
- 11462 81st Place N
- 11760 88th Place N
- 14877 106th Ave N
- 9058 Goldenrod Ln N
- 12598 84th Place N
- 12509 88th Ave N
- 8025 Larch Ln N
- 8326 Oakview Ct N
- 11318 86th Ave N
- 11314 86th Ave N
- 11320 86th Ave N
- 11322 86th Ave N
- 11242 86th Ave N
- 11332 86th Ave N
- 11334 86th Ave N
- 11212 86th Ave N
- 11290 86th Ave N
- 11210 86th Ave N
- 11234 86th Ave N
- 11234 86th Ave N Unit 35
- 11505 85th Place N
- 11258 86th Ave N
- 11516 85th Place N
- 11523 85th Place N
- 8534 Deerwood Ln N
- 11252 86th Ave N
- 11280 86th Ave N
- 11202 86th Ave N