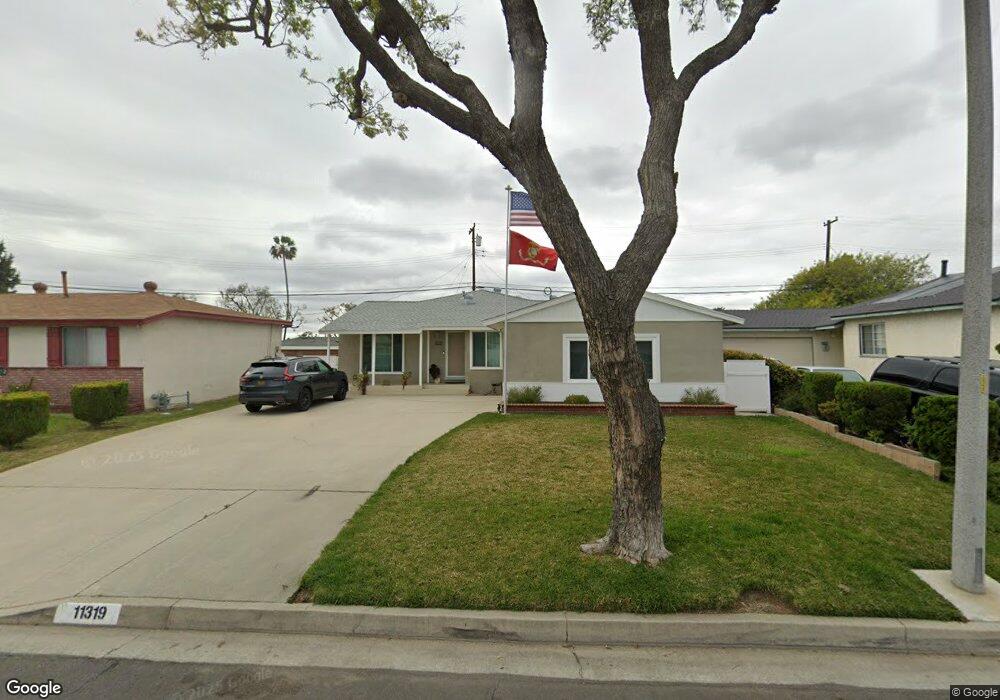
11319 Archway Dr Whittier, CA 90604
South Whittier NeighborhoodEstimated Value: $767,580 - $833,000
3
Beds
2
Baths
1,665
Sq Ft
$478/Sq Ft
Est. Value
About This Home
This home is located at 11319 Archway Dr, Whittier, CA 90604 and is currently estimated at $795,395, approximately $477 per square foot. 11319 Archway Dr is a home located in Los Angeles County with nearby schools including La Colima Elementary School, Granada Middle School, and La Serna High School.
Ownership History
Date
Name
Owned For
Owner Type
Purchase Details
Closed on
Mar 20, 2023
Sold by
Wilson Julio Cesar
Bought by
Wilson Family Trust
Current Estimated Value
Purchase Details
Closed on
Nov 29, 2011
Sold by
Department Of Veterans Affairs
Bought by
Wilson Julio Cesar and Wilson Veronica
Home Financials for this Owner
Home Financials are based on the most recent Mortgage that was taken out on this home.
Original Mortgage
$256,000
Interest Rate
3.94%
Mortgage Type
New Conventional
Purchase Details
Closed on
Sep 10, 2003
Sold by
Aguilera Lynn S
Bought by
Va
Purchase Details
Closed on
Sep 23, 2002
Sold by
Aguilera Lynn and Guzman Linda S
Bought by
Aguilera Lynn S
Home Financials for this Owner
Home Financials are based on the most recent Mortgage that was taken out on this home.
Original Mortgage
$153,000
Interest Rate
6.16%
Purchase Details
Closed on
Mar 27, 1994
Sold by
Aquilera Salvador J and Aquilera Lynn
Bought by
Aquilera Lynn and Guzman Linda S
Create a Home Valuation Report for This Property
The Home Valuation Report is an in-depth analysis detailing your home's value as well as a comparison with similar homes in the area
Home Values in the Area
Average Home Value in this Area
Purchase History
| Date | Buyer | Sale Price | Title Company |
|---|---|---|---|
| Wilson Family Trust | -- | -- | |
| Wilson Julio Cesar | -- | Pacific Coast Title | |
| Va | $310,000 | Southland Title | |
| Aguilera Lynn S | -- | Landsafe Title | |
| Aquilera Lynn | -- | -- |
Source: Public Records
Mortgage History
| Date | Status | Borrower | Loan Amount |
|---|---|---|---|
| Previous Owner | Wilson Julio Cesar | $256,000 | |
| Previous Owner | Aguilera Lynn S | $153,000 |
Source: Public Records
Tax History Compared to Growth
Tax History
| Year | Tax Paid | Tax Assessment Tax Assessment Total Assessment is a certain percentage of the fair market value that is determined by local assessors to be the total taxable value of land and additions on the property. | Land | Improvement |
|---|---|---|---|---|
| 2025 | $5,818 | $548,079 | $335,248 | $212,831 |
| 2024 | $5,818 | $478,458 | $328,675 | $149,783 |
| 2023 | $5,717 | $469,078 | $322,231 | $146,847 |
| 2022 | $5,097 | $415,181 | $315,913 | $99,268 |
| 2021 | $4,997 | $407,041 | $309,719 | $97,322 |
| 2019 | $4,895 | $394,971 | $300,534 | $94,437 |
| 2018 | $4,728 | $387,228 | $294,642 | $92,586 |
| 2016 | $4,477 | $372,193 | $283,201 | $88,992 |
| 2015 | $4,448 | $366,604 | $278,948 | $87,656 |
| 2014 | $4,386 | $359,423 | $273,484 | $85,939 |
Source: Public Records
Map
Nearby Homes
- 14927 Leffingwell Rd Unit 22
- 14927 Leffingwell Rd Unit 17
- 11134 Arroyo Dr
- 11735 Gayview Dr
- 11314 La Mirada Blvd
- 15041 Cerecita Dr
- 11502 Double Eagle Dr
- 11518 Toerge Dr
- 15026 Olive Ln
- 15032 Olive Ln
- 12108 Springview Dr
- 10857 La Mirada Blvd
- 10847 La Mirada Blvd
- 10855 Colima Rd
- 10822 Colima Rd
- 12212 Hillwood Dr
- 15216 Mccann Place
- 11124 Stamy Rd
- 14865 Mulberry Dr Unit 1101
- 12311 Moline Dr
- 11313 Archway Dr
- 11331 Archway Dr
- 11309 Archway Dr
- 11324 Thrace Dr
- 11330 Thrace Dr
- 11318 Thrace Dr
- 11336 Thrace Dr
- 11316 Archway Dr
- 11322 Archway Dr
- 11303 Archway Dr
- 11349 Archway Dr
- 11310 Archway Dr
- 11314 Thrace Dr
- 11328 Archway Dr
- 11304 Archway Dr
- 11332 Archway Dr
- 11245 Archway Dr
- 11246 Archway Dr
- 11336 Archway Dr
- 11308 Thrace Dr