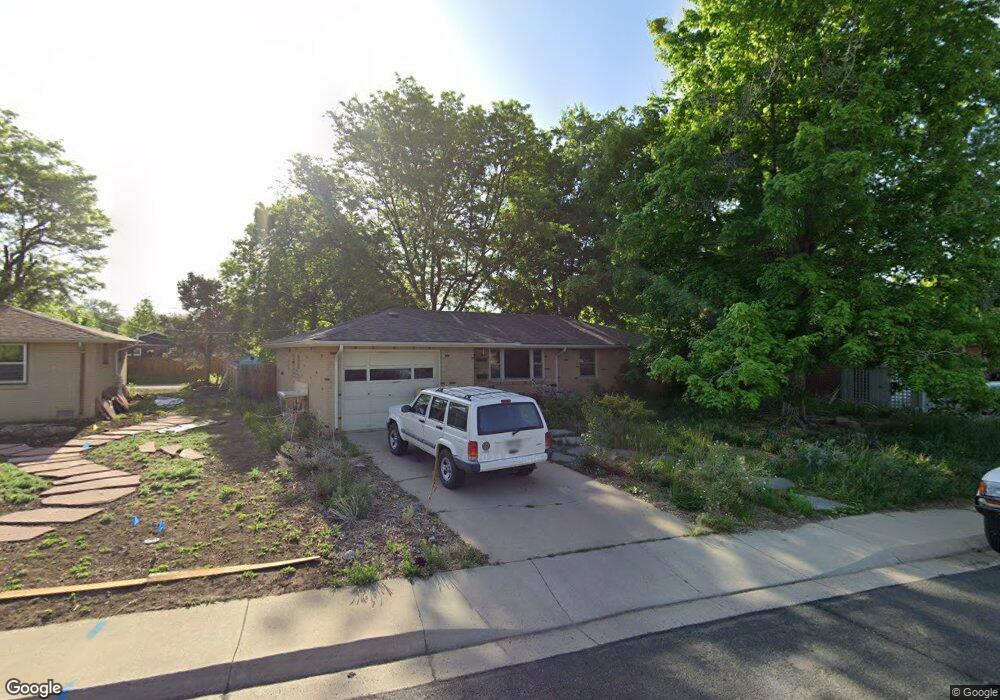
1132 Sherman St Longmont, CO 80501
Loomiller NeighborhoodEstimated Value: $425,000 - $437,000
2
Beds
1
Bath
1,052
Sq Ft
$409/Sq Ft
Est. Value
About This Home
This home is located at 1132 Sherman St, Longmont, CO 80501 and is currently estimated at $430,055, approximately $408 per square foot. 1132 Sherman St is a home located in Boulder County with nearby schools including Mountain View Elementary School, Longs Peak Middle School, and Longmont High School.
Ownership History
Date
Name
Owned For
Owner Type
Purchase Details
Closed on
Mar 22, 2017
Sold by
Energy Resources Technology Land Inc
Bought by
Cole Clayton
Current Estimated Value
Home Financials for this Owner
Home Financials are based on the most recent Mortgage that was taken out on this home.
Original Mortgage
$224,000
Outstanding Balance
$185,753
Interest Rate
4.17%
Mortgage Type
New Conventional
Estimated Equity
$244,302
Purchase Details
Closed on
Dec 17, 2003
Sold by
Jackson Robert W and Estate Of Evelyne Irene Cummin
Bought by
Energy Resources Technology Land Inc
Purchase Details
Closed on
Jun 28, 1996
Sold by
Erickson James A
Bought by
Cummings Evelyne C
Purchase Details
Closed on
Sep 29, 1994
Sold by
Vickery Mildred
Bought by
Erickson James A
Home Financials for this Owner
Home Financials are based on the most recent Mortgage that was taken out on this home.
Original Mortgage
$90,400
Interest Rate
5.5%
Purchase Details
Closed on
May 29, 1967
Bought by
Energy Resources Technology Land Inc
Create a Home Valuation Report for This Property
The Home Valuation Report is an in-depth analysis detailing your home's value as well as a comparison with similar homes in the area
Home Values in the Area
Average Home Value in this Area
Purchase History
| Date | Buyer | Sale Price | Title Company |
|---|---|---|---|
| Cole Clayton | $280,000 | Stewart Title | |
| Energy Resources Technology Land Inc | $475,700 | -- | |
| Cummings Evelyne C | $125,000 | -- | |
| Erickson James A | $113,000 | -- | |
| Energy Resources Technology Land Inc | -- | -- |
Source: Public Records
Mortgage History
| Date | Status | Borrower | Loan Amount |
|---|---|---|---|
| Open | Cole Clayton | $224,000 | |
| Previous Owner | Erickson James A | $90,400 |
Source: Public Records
Tax History Compared to Growth
Tax History
| Year | Tax Paid | Tax Assessment Tax Assessment Total Assessment is a certain percentage of the fair market value that is determined by local assessors to be the total taxable value of land and additions on the property. | Land | Improvement |
|---|---|---|---|---|
| 2025 | $2,185 | $24,344 | $5,513 | $18,831 |
| 2024 | $2,185 | $24,344 | $5,513 | $18,831 |
| 2023 | $2,156 | $22,847 | $6,144 | $20,388 |
| 2022 | $1,977 | $19,982 | $4,518 | $15,464 |
| 2021 | $2,003 | $20,557 | $4,648 | $15,909 |
| 2020 | $1,762 | $18,140 | $4,076 | $14,064 |
| 2019 | $1,734 | $18,140 | $4,076 | $14,064 |
| 2018 | $1,403 | $14,767 | $3,600 | $11,167 |
| 2017 | $1,384 | $16,326 | $3,980 | $12,346 |
| 2016 | $1,371 | $14,344 | $4,935 | $9,409 |
| 2015 | $1,307 | $12,306 | $3,900 | $8,406 |
| 2014 | $1,149 | $12,306 | $3,900 | $8,406 |
Source: Public Records
Map
Nearby Homes
- 1217 Lincoln St
- 1247 Lincoln St
- 1224 Judson St
- 1202 Vivian St
- 1153 Vivian St
- 1136 Venice St
- 1209 Gay St
- 1314 Venice St
- 1344 Aspen Place
- 1245 Sumner St
- 1208 Juniper St
- 1365 15th Ave
- 1214 9th Ave
- 1061 Townley Cir
- 818 Lincoln St
- 1012 Pratt St Unit 1012
- 1019 Alta St Unit 1019
- 813 Vivian St
- 1414 Linden St
- 814 Gay St
- 1138 Sherman St
- 1126 Sherman St
- 1133 Grant St
- 1144 Sherman St
- 1120 Sherman St
- 1139 Grant St
- 1127 Grant St
- 1135 Sherman St
- 1129 Sherman St
- 1141 Sherman St
- 1145 Grant St
- 1121 Grant St
- 1150 Sherman St
- 1147 Sherman St
- 1114 Sherman St
- 1123 Sherman St
- 1151 Grant St
- 1115 Grant St
- 1117 Sherman St
- 1108 Sherman St