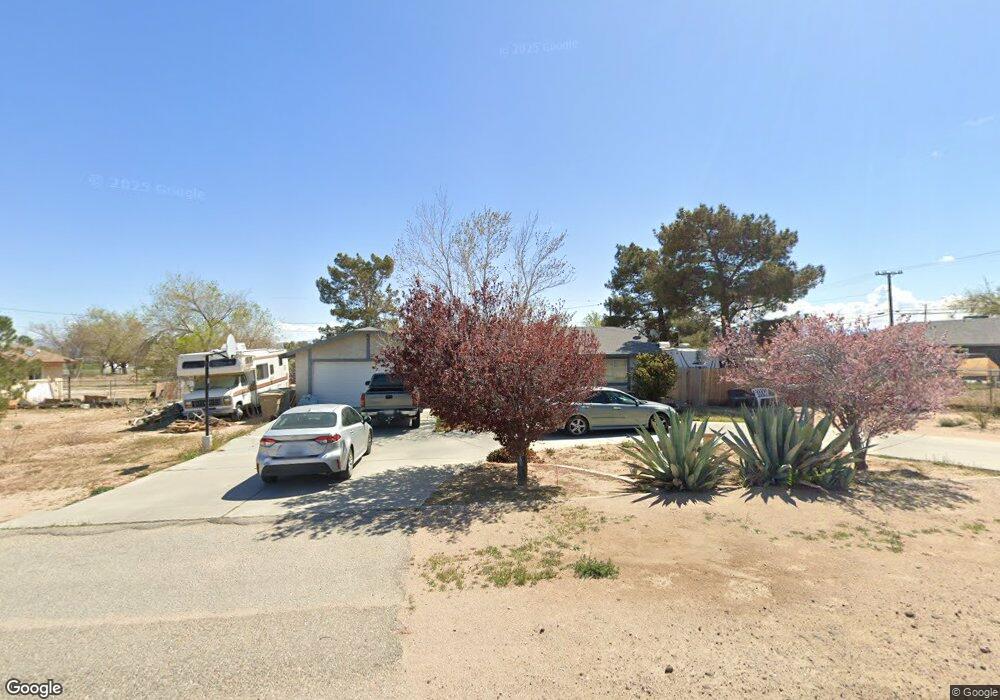
11327 Shangri la Ave Hesperia, CA 92345
Estimated Value: $400,000 - $423,000
3
Beds
2
Baths
1,284
Sq Ft
$321/Sq Ft
Est. Value
About This Home
This home is located at 11327 Shangri la Ave, Hesperia, CA 92345 and is currently estimated at $412,444, approximately $321 per square foot. 11327 Shangri la Ave is a home located in San Bernardino County with nearby schools including Maple Elementary School, Hesperia Junior High School, and Hesperia High School.
Ownership History
Date
Name
Owned For
Owner Type
Purchase Details
Closed on
May 22, 2007
Sold by
Goodro Darell R
Bought by
Goodro Darell R
Current Estimated Value
Home Financials for this Owner
Home Financials are based on the most recent Mortgage that was taken out on this home.
Original Mortgage
$151,000
Outstanding Balance
$91,698
Interest Rate
6.14%
Mortgage Type
New Conventional
Estimated Equity
$320,746
Purchase Details
Closed on
Feb 21, 2002
Sold by
Goodro Wanda Jean
Bought by
Goodro Darell R
Home Financials for this Owner
Home Financials are based on the most recent Mortgage that was taken out on this home.
Original Mortgage
$99,015
Interest Rate
6.85%
Purchase Details
Closed on
Feb 8, 2002
Sold by
Mann Gordon S and Mann Lori J
Bought by
Goodro Darell R
Home Financials for this Owner
Home Financials are based on the most recent Mortgage that was taken out on this home.
Original Mortgage
$99,015
Interest Rate
6.85%
Create a Home Valuation Report for This Property
The Home Valuation Report is an in-depth analysis detailing your home's value as well as a comparison with similar homes in the area
Home Values in the Area
Average Home Value in this Area
Purchase History
| Date | Buyer | Sale Price | Title Company |
|---|---|---|---|
| Goodro Darell R | -- | Chicago Title Company | |
| Goodro Darell R | -- | First American Title Ins Co | |
| Goodro Darell R | $100,000 | First American Title Ins Co |
Source: Public Records
Mortgage History
| Date | Status | Borrower | Loan Amount |
|---|---|---|---|
| Open | Goodro Darell R | $151,000 | |
| Closed | Goodro Darell R | $99,015 |
Source: Public Records
Tax History Compared to Growth
Tax History
| Year | Tax Paid | Tax Assessment Tax Assessment Total Assessment is a certain percentage of the fair market value that is determined by local assessors to be the total taxable value of land and additions on the property. | Land | Improvement |
|---|---|---|---|---|
| 2025 | $1,570 | $147,585 | $25,089 | $122,496 |
| 2024 | $1,570 | $144,691 | $24,597 | $120,094 |
| 2023 | $1,552 | $141,854 | $24,115 | $117,739 |
| 2022 | $1,515 | $139,072 | $23,642 | $115,430 |
| 2021 | $1,487 | $136,345 | $23,178 | $113,167 |
| 2020 | $1,469 | $134,947 | $22,940 | $112,007 |
| 2019 | $1,438 | $132,301 | $22,490 | $109,811 |
| 2018 | $1,410 | $129,707 | $22,049 | $107,658 |
| 2017 | $1,384 | $127,164 | $21,617 | $105,547 |
| 2016 | $1,354 | $124,670 | $21,193 | $103,477 |
| 2015 | $1,336 | $122,798 | $20,875 | $101,923 |
| 2014 | $1,317 | $120,392 | $20,466 | $99,926 |
Source: Public Records
Map
Nearby Homes
- 14572 Appleton St
- 11482 Maple Ave
- 14610 Appleton St
- 11494 Primrose Ave
- 11558 Hemlock Ave
- 11516 Oakwood Ave
- 11546 Oakwood Ave
- 11031 Victor Ave
- 11152 Redwood Ave
- 11093 Lincoln Ave
- 14431 Welsh Ct
- 13845 Raven St
- 11625 Halter St
- 14999 Lilac St
- 13833 Raven St
- 10630 Appaloosa Ave
- 10619 Appaloosa Ave
- 0 Mesa St Unit HD25166908
- 0 Mesa St Unit HD25146689
- 0 Veterans' Memorial Hwy
- 11353 Shangri la Ave
- 11319 Shangri la Ave
- 11330 Maple Ave
- 11350 Maple Ave
- 11316 Maple Ave
- 11367 Shangri la Ave
- 14440 Eucalyptus St
- 11350 Shangri la Ave
- 11370 Maple Ave
- 11370 Shangri la Ave
- 11385 Shangri la Ave
- 11327 Primrose Ave
- 11388 Maple Ave
- 14410 Eucalyptus St
- 11353 Primrose Ave
- 14524 Eucalyptus St
- 11388 Shangri la Ave
- 11367 Primrose Ave
- 11409 Shangri la Ave
- 11363 Maple Ave