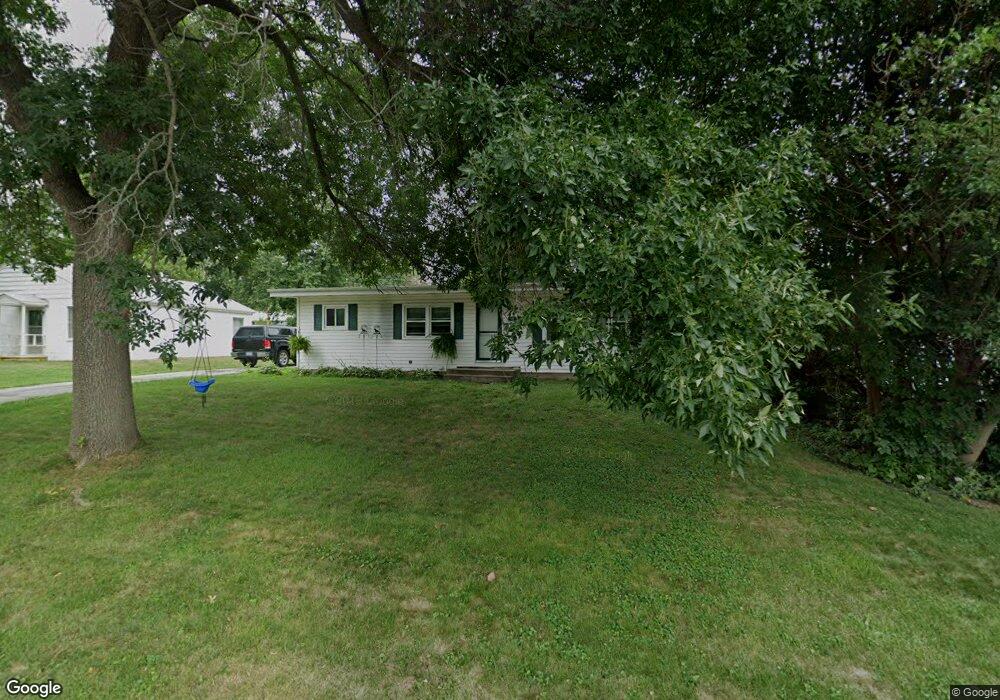
1133 26th St Marion, IA 52302
Estimated Value: $174,000 - $207,000
3
Beds
1
Bath
1,176
Sq Ft
$158/Sq Ft
Est. Value
About This Home
This home is located at 1133 26th St, Marion, IA 52302 and is currently estimated at $186,033, approximately $158 per square foot. 1133 26th St is a home located in Linn County with nearby schools including Francis Marion Intermediate School, Vernon Middle School, and Marion High School.
Ownership History
Date
Name
Owned For
Owner Type
Purchase Details
Closed on
May 14, 2021
Sold by
Dhooge Donald L and Dhooge Teresa M
Bought by
Dhooge Donald L
Current Estimated Value
Home Financials for this Owner
Home Financials are based on the most recent Mortgage that was taken out on this home.
Original Mortgage
$80,000
Outstanding Balance
$60,567
Interest Rate
3.1%
Mortgage Type
New Conventional
Estimated Equity
$125,466
Purchase Details
Closed on
Nov 7, 2016
Sold by
Dhooge Don L and Dhooge Teresa M
Bought by
Dhooge Donald L and Dhooge Teresa M
Home Financials for this Owner
Home Financials are based on the most recent Mortgage that was taken out on this home.
Original Mortgage
$84,000
Interest Rate
2.72%
Mortgage Type
New Conventional
Purchase Details
Closed on
Sep 19, 2001
Sold by
Dhooge Don L and Dhooge Theresa Jo
Bought by
Dhooge Don L
Purchase Details
Closed on
Oct 5, 1998
Sold by
Jansa & Sons Inc
Bought by
Shebetka Jon R and Shebetka Sandra
Create a Home Valuation Report for This Property
The Home Valuation Report is an in-depth analysis detailing your home's value as well as a comparison with similar homes in the area
Home Values in the Area
Average Home Value in this Area
Purchase History
| Date | Buyer | Sale Price | Title Company |
|---|---|---|---|
| Dhooge Donald L | -- | None Available | |
| Dhooge Donald L | -- | None Available | |
| Dhooge Don L | -- | -- | |
| Shebetka Jon R | -- | -- |
Source: Public Records
Mortgage History
| Date | Status | Borrower | Loan Amount |
|---|---|---|---|
| Open | Dhooge Donald L | $80,000 | |
| Closed | Dhooge Donald L | $84,000 |
Source: Public Records
Tax History Compared to Growth
Tax History
| Year | Tax Paid | Tax Assessment Tax Assessment Total Assessment is a certain percentage of the fair market value that is determined by local assessors to be the total taxable value of land and additions on the property. | Land | Improvement |
|---|---|---|---|---|
| 2025 | $2,860 | $174,900 | $24,000 | $150,900 |
| 2024 | $2,630 | $162,900 | $24,000 | $138,900 |
| 2023 | $2,630 | $162,900 | $24,000 | $138,900 |
| 2022 | $2,540 | $127,100 | $24,000 | $103,100 |
| 2021 | $2,414 | $127,100 | $24,000 | $103,100 |
| 2020 | $2,414 | $115,400 | $24,000 | $91,400 |
| 2019 | $2,268 | $109,200 | $24,000 | $85,200 |
| 2018 | $2,214 | $109,200 | $24,000 | $85,200 |
| 2017 | $2,368 | $106,400 | $24,000 | $82,400 |
| 2016 | $2,368 | $106,400 | $24,000 | $82,400 |
| 2015 | $2,357 | $106,400 | $24,000 | $82,400 |
| 2014 | $2,164 | $106,400 | $24,000 | $82,400 |
| 2013 | $2,078 | $106,400 | $24,000 | $82,400 |
Source: Public Records
Map
Nearby Homes