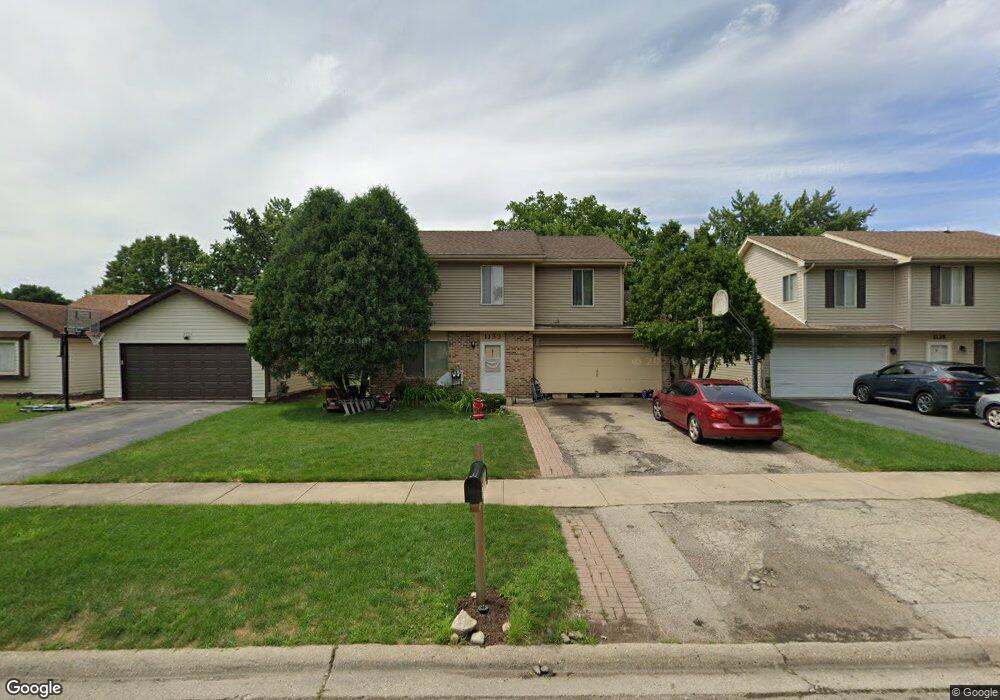
1133 Andover Ct Naperville, IL 60563
Springhill NeighborhoodEstimated Value: $413,000 - $505,000
Studio
1
Bath
1,818
Sq Ft
$247/Sq Ft
Est. Value
About This Home
This home is located at 1133 Andover Ct, Naperville, IL 60563 and is currently estimated at $449,227, approximately $247 per square foot. 1133 Andover Ct is a home located in DuPage County with nearby schools including Ellsworth Elementary School, Washington Jr High School, and Naperville North High School.
Ownership History
Date
Name
Owned For
Owner Type
Purchase Details
Closed on
Aug 21, 2008
Sold by
Uribe Jose and Lozano Angelica
Bought by
Uribe Jose and Lozano Angelica
Current Estimated Value
Home Financials for this Owner
Home Financials are based on the most recent Mortgage that was taken out on this home.
Original Mortgage
$186,200
Outstanding Balance
$123,521
Interest Rate
6.55%
Mortgage Type
Stand Alone Refi Refinance Of Original Loan
Estimated Equity
$325,706
Purchase Details
Closed on
Oct 7, 2002
Sold by
Gonzales Candace Gail
Bought by
Uribe Jose and Uribe Joel
Home Financials for this Owner
Home Financials are based on the most recent Mortgage that was taken out on this home.
Original Mortgage
$213,977
Interest Rate
6.18%
Mortgage Type
FHA
Purchase Details
Closed on
Nov 20, 1993
Sold by
Gonzales Daniel Carrasco and Gonzales Candace Gail
Bought by
Gonzales Candace Gail
Create a Home Valuation Report for This Property
The Home Valuation Report is an in-depth analysis detailing your home's value as well as a comparison with similar homes in the area
Home Values in the Area
Average Home Value in this Area
Purchase History
| Date | Buyer | Sale Price | Title Company |
|---|---|---|---|
| Uribe Jose | -- | Marquis Title | |
| Uribe Jose | $217,000 | Law Title | |
| Gonzales Candace Gail | -- | -- |
Source: Public Records
Mortgage History
| Date | Status | Borrower | Loan Amount |
|---|---|---|---|
| Open | Uribe Jose | $186,200 | |
| Closed | Uribe Jose | $213,977 |
Source: Public Records
Tax History
| Year | Tax Paid | Tax Assessment Tax Assessment Total Assessment is a certain percentage of the fair market value that is determined by local assessors to be the total taxable value of land and additions on the property. | Land | Improvement |
|---|---|---|---|---|
| 2024 | $7,120 | $124,220 | $50,534 | $73,686 |
| 2023 | $6,847 | $113,370 | $46,120 | $67,250 |
| 2022 | $6,432 | $105,390 | $42,870 | $62,520 |
| 2021 | $6,193 | $101,410 | $41,250 | $60,160 |
| 2020 | $6,059 | $99,590 | $40,510 | $59,080 |
| 2019 | $5,877 | $95,280 | $38,760 | $56,520 |
| 2018 | $5,637 | $91,620 | $37,270 | $54,350 |
| 2017 | $5,519 | $88,530 | $36,010 | $52,520 |
| 2016 | $5,403 | $85,330 | $34,710 | $50,620 |
| 2015 | $5,360 | $80,360 | $32,690 | $47,670 |
| 2014 | $5,320 | $77,470 | $31,510 | $45,960 |
| 2013 | $5,240 | $77,660 | $31,590 | $46,070 |
Source: Public Records
Map
Nearby Homes
- 825 Biltmore Ct
- 941 Coletta Cir
- 906 Coletta Cir
- 25W313 Mayflower Ave
- 1111 Samstag Ct
- 1165 Dickens Ave
- 596 Windham Ln
- 634 E 5th Ave
- 5S661 Wright St
- 1437 N Charles Ave
- 6S241 Concord Rd
- 5S504 Radcliff Rd
- 5S365 Vest Ave
- 26W250 Case St
- 30w130 Wheeler Cir
- 5S345 Naperville Wheaton Rd
- 340 N Wright St
- 5S300 Tuthill Rd
- 930 N Loomis St
- 952 N Loomis St
- 1135 Andover Ct
- 1131 Andover Ct
- 1137 Andover Ct
- 1132 Needham Rd
- 1134 Needham Rd
- 1130 Needham Rd
- 1139 Andover Ct
- 1132 Andover Ct
- 1136 Needham Rd Unit 1
- 1130 Andover Ct
- 1134 Andover Ct
- 1138 Needham Rd
- 1141 Andover Ct
- 1136 Andover Ct
- 705 Springhill Cir
- 1138 Andover Ct
- 1140 Needham Rd
- 1124 Needham Rd
- 1142 Needham Rd
- 1143 Andover Ct
Your Personal Tour Guide
Ask me questions while you tour the home.