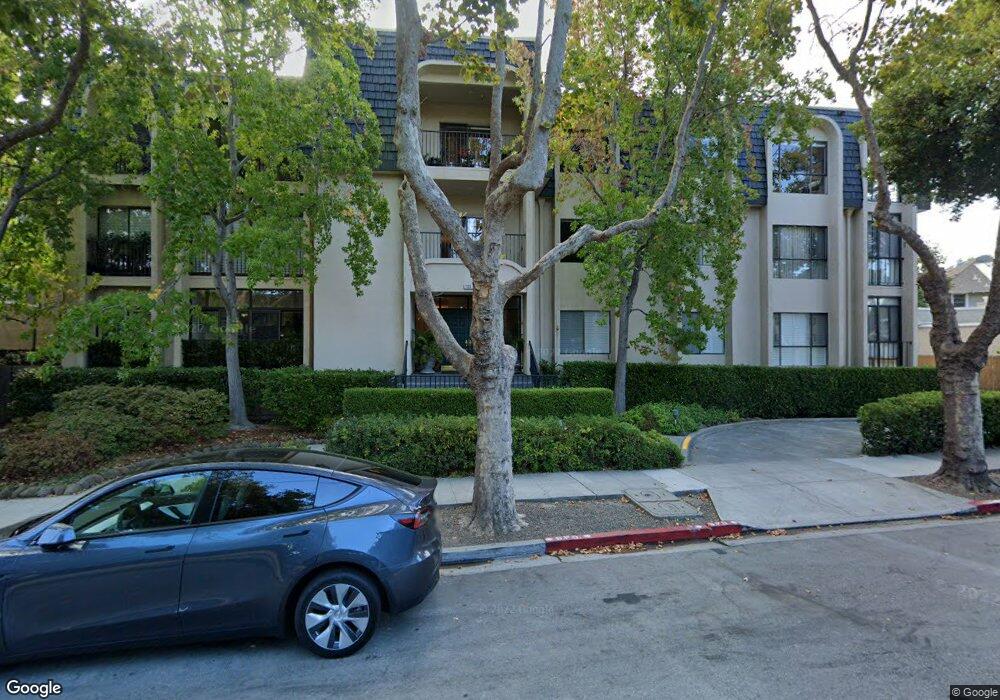
1133 Douglas Ave Unit 8 Burlingame, CA 94010
Downtown Burlingame NeighborhoodEstimated Value: $1,011,000 - $1,681,000
2
Beds
2
Baths
1,427
Sq Ft
$852/Sq Ft
Est. Value
About This Home
This home is located at 1133 Douglas Ave Unit 8, Burlingame, CA 94010 and is currently estimated at $1,215,491, approximately $851 per square foot. 1133 Douglas Ave Unit 8 is a home located in San Mateo County with nearby schools including McKinley Elementary School, Burlingame Intermediate School, and Burlingame High School.
Ownership History
Date
Name
Owned For
Owner Type
Purchase Details
Closed on
Jul 25, 2012
Sold by
Hesslegren Timothy Warren
Bought by
Root John S and Root Carolyn L
Current Estimated Value
Home Financials for this Owner
Home Financials are based on the most recent Mortgage that was taken out on this home.
Original Mortgage
$775,000
Outstanding Balance
$535,620
Interest Rate
3.62%
Mortgage Type
Purchase Money Mortgage
Estimated Equity
$679,871
Purchase Details
Closed on
May 18, 2007
Sold by
Hesselgren Ruth F
Bought by
Hesselgren Ruth F
Home Financials for this Owner
Home Financials are based on the most recent Mortgage that was taken out on this home.
Original Mortgage
$250,000
Interest Rate
6.17%
Mortgage Type
Stand Alone Refi Refinance Of Original Loan
Purchase Details
Closed on
Sep 25, 2006
Sold by
Bastion Jean Anita
Bought by
Hesselgren Ruth F
Home Financials for this Owner
Home Financials are based on the most recent Mortgage that was taken out on this home.
Original Mortgage
$589,760
Interest Rate
6.43%
Mortgage Type
Stand Alone First
Purchase Details
Closed on
May 4, 2005
Sold by
Bastion Jean Anita
Bought by
Bastion Jean Anita
Create a Home Valuation Report for This Property
The Home Valuation Report is an in-depth analysis detailing your home's value as well as a comparison with similar homes in the area
Home Values in the Area
Average Home Value in this Area
Purchase History
| Date | Buyer | Sale Price | Title Company |
|---|---|---|---|
| Root John S | $775,000 | North American Title Co Inc | |
| Hesselgren Ruth F | -- | Fidelity National Title Co | |
| Hesselgren Ruth F | $737,500 | Fidelity National Title Co | |
| Bastion Jean Anita | -- | -- |
Source: Public Records
Mortgage History
| Date | Status | Borrower | Loan Amount |
|---|---|---|---|
| Open | Root John S | $775,000 | |
| Previous Owner | Hesselgren Ruth F | $250,000 | |
| Previous Owner | Hesselgren Ruth F | $589,760 |
Source: Public Records
Tax History Compared to Growth
Tax History
| Year | Tax Paid | Tax Assessment Tax Assessment Total Assessment is a certain percentage of the fair market value that is determined by local assessors to be the total taxable value of land and additions on the property. | Land | Improvement |
|---|---|---|---|---|
| 2025 | $10,708 | $954,345 | $286,301 | $668,044 |
| 2023 | $10,708 | $917,289 | $275,185 | $642,104 |
| 2022 | $10,329 | $899,304 | $269,790 | $629,514 |
| 2021 | $10,342 | $881,671 | $264,500 | $617,171 |
| 2020 | $10,130 | $872,631 | $261,788 | $610,843 |
| 2019 | $9,906 | $855,521 | $256,655 | $598,866 |
| 2018 | $9,719 | $838,747 | $251,623 | $587,124 |
| 2017 | $9,648 | $822,302 | $246,690 | $575,612 |
| 2016 | $9,291 | $806,179 | $241,853 | $564,326 |
| 2015 | $9,250 | $794,071 | $238,221 | $555,850 |
| 2014 | $9,116 | $778,517 | $233,555 | $544,962 |
Source: Public Records
Map
Nearby Homes
- 1133 Douglas Ave Unit 3
- 1121 Douglas Ave Unit 201
- 1427 Floribunda Ave Unit 304
- 1433 Floribunda Ave Unit 5
- 1433 Floribunda Ave Unit 7
- 1433 Floribunda Ave Unit 2
- 1433 Floribunda Ave Unit 1
- 737 Linden Ave
- 1515 Floribunda Ave Unit 309
- 550 El Camino Real Unit 302
- 110 Park Rd Unit 103
- 732 Paloma Ave
- 733 Lexington Way
- 735 El Camino Real Unit 104
- 777 Morrell Ave Unit 302
- 1030 Morrell Ave
- 824 El Camino Real
- 680 Fairway Cir
- 828 N El Camino Real Unit 9
- 481 Rollins Rd
- 1133 Douglas Ave Unit 303
- 1133 Douglas Ave Unit 103
- 1133 Douglas Ave Unit 202
- 1133 Douglas Ave Unit 9
- 1133 Douglas Ave Unit 301
- 1133 Douglas Ave Unit 6
- 1133 Douglas Ave Unit 5
- 1133 Douglas Ave Unit 4
- 1133 Douglas Ave Unit 2
- 1133 Douglas Ave Unit 101
- 1121 Douglas Ave Unit 2013
- 1121 Douglas Ave Unit 301
- 1121 Douglas Ave
- 1121 Douglas Ave
- 1121 Douglas Ave Unit 202
- 1121 Douglas Ave
- 1121 Douglas Ave Unit 101
- 1121 Douglas Ave Unit 303
- 1121 Douglas Ave
- 1137 Douglas Ave