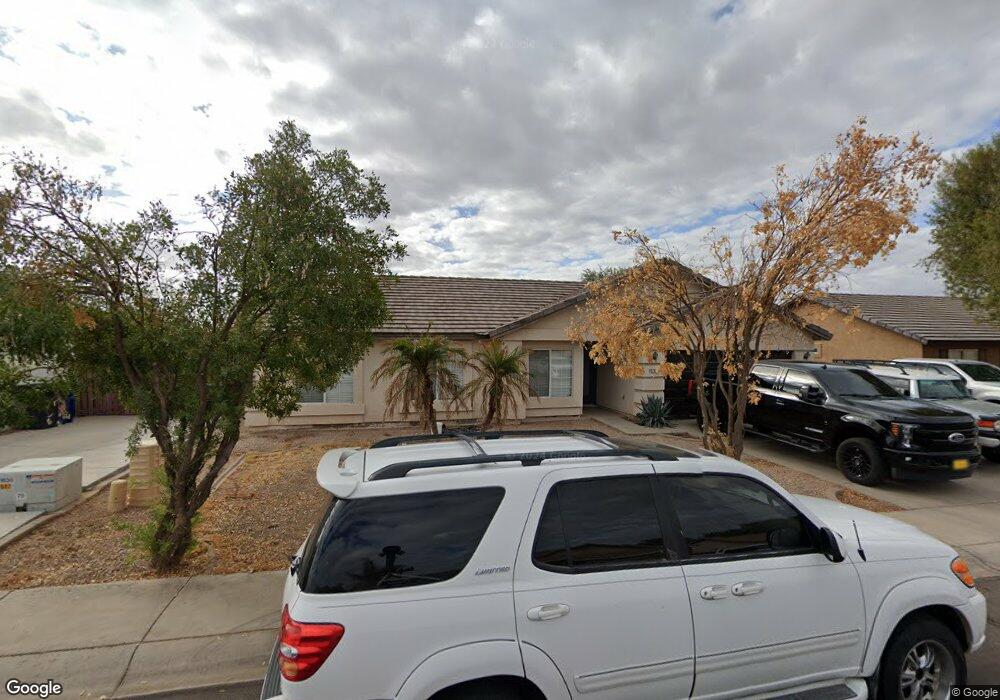
11331 E Rutledge Ave Mesa, AZ 85212
Superstition Vistas NeighborhoodEstimated Value: $411,527 - $477,000
4
Beds
2
Baths
1,486
Sq Ft
$292/Sq Ft
Est. Value
About This Home
This home is located at 11331 E Rutledge Ave, Mesa, AZ 85212 and is currently estimated at $433,632, approximately $291 per square foot. 11331 E Rutledge Ave is a home located in Maricopa County with nearby schools including Desert Ridge Jr. High School, Desert Ridge High School, and Ala Mesa.
Ownership History
Date
Name
Owned For
Owner Type
Purchase Details
Closed on
Mar 30, 2021
Sold by
Dixon Branden and Dixon Ashley
Bought by
Diepstraten Krista A
Current Estimated Value
Home Financials for this Owner
Home Financials are based on the most recent Mortgage that was taken out on this home.
Original Mortgage
$326,500
Outstanding Balance
$293,834
Interest Rate
2.8%
Mortgage Type
New Conventional
Estimated Equity
$139,798
Purchase Details
Closed on
Apr 28, 2004
Sold by
Ross Ryan T and Ross Peggy J
Bought by
Dixon Branden and Dixon Ashley
Home Financials for this Owner
Home Financials are based on the most recent Mortgage that was taken out on this home.
Original Mortgage
$121,520
Interest Rate
6.41%
Mortgage Type
New Conventional
Purchase Details
Closed on
Nov 28, 2001
Sold by
Providence Homes Inc
Bought by
Ross Ryan T and Ross Peggy J
Home Financials for this Owner
Home Financials are based on the most recent Mortgage that was taken out on this home.
Original Mortgage
$130,224
Interest Rate
6.63%
Mortgage Type
FHA
Create a Home Valuation Report for This Property
The Home Valuation Report is an in-depth analysis detailing your home's value as well as a comparison with similar homes in the area
Home Values in the Area
Average Home Value in this Area
Purchase History
| Date | Buyer | Sale Price | Title Company |
|---|---|---|---|
| Diepstraten Krista A | $350,000 | First American Title Ins Co | |
| Dixon Branden | $151,900 | Fidelity National Title | |
| Ross Ryan T | $132,095 | Security Title Agency | |
| Providence Homes Inc | $115,583 | Security Title Agency |
Source: Public Records
Mortgage History
| Date | Status | Borrower | Loan Amount |
|---|---|---|---|
| Open | Diepstraten Krista A | $326,500 | |
| Previous Owner | Dixon Branden | $121,520 | |
| Previous Owner | Ross Ryan T | $130,224 | |
| Closed | Dixon Branden | $30,380 |
Source: Public Records
Tax History
| Year | Tax Paid | Tax Assessment Tax Assessment Total Assessment is a certain percentage of the fair market value that is determined by local assessors to be the total taxable value of land and additions on the property. | Land | Improvement |
|---|---|---|---|---|
| 2025 | $1,405 | $18,964 | -- | -- |
| 2024 | $1,363 | $18,061 | -- | -- |
| 2023 | $1,363 | $31,870 | $6,370 | $25,500 |
| 2022 | $1,330 | $25,650 | $5,130 | $20,520 |
| 2021 | $1,440 | $23,260 | $4,650 | $18,610 |
| 2020 | $1,673 | $22,200 | $4,440 | $17,760 |
| 2019 | $1,565 | $20,230 | $4,040 | $16,190 |
| 2018 | $1,744 | $18,560 | $3,710 | $14,850 |
| 2017 | $1,209 | $15,580 | $3,110 | $12,470 |
| 2016 | $1,248 | $15,260 | $3,050 | $12,210 |
| 2015 | $1,150 | $14,370 | $2,870 | $11,500 |
Source: Public Records
Map
Nearby Homes
- 11548 E Corbin Ave
- 4419 S Adelle
- 4539 S Antonio
- 11322 E Rembrandt Ave
- 11436 E Sonrisa Ave
- 11441 E Sonrisa Ave
- 11051 E Sebring Ave
- 4746 S Emery
- 10933 E Renfield Ave
- 4755 S Grenoble Cir
- 11264 E Sheridan Ave Unit 1
- 4747 S Carmine Cir
- 4613 S Dante Cir
- 11223 E Raleigh Ave Unit 3
- 10853 E Sebring Ave
- 11355 E Solina Cir
- 10830 E Ramona Ave
- 10831 E Sylvan Ave
- 4610 S Hassett Cir
- 4620 S Hassett
- 11339 E Rutledge Ave
- 11323 E Rutledge Ave
- 11347 E Rutledge Ave
- 11315 E Rutledge Ave
- 11330 E Rutledge Ave
- 11338 E Rutledge Ave
- 11322 E Rutledge Ave
- 11307 E Rutledge Ave
- 11355 E Rutledge Ave
- 11314 E Rutledge Ave
- 11346 E Rutledge Ave
- 11334 E Shepperd Ave
- 11342 E Shepperd Ave
- 11306 E Rutledge Ave
- 11326 E Shepperd Ave Unit 1
- 11350 E Shepperd Ave Unit 1
- 11265 E Rutledge Ave
- 11354 E Rutledge Ave
- 11318 E Shepperd Ave
- 11329 E Roscoe Ave
Your Personal Tour Guide
Ask me questions while you tour the home.