Estimated Value: $123,668
--
Bed
--
Bath
4,464
Sq Ft
$28/Sq Ft
Est. Value
About This Home
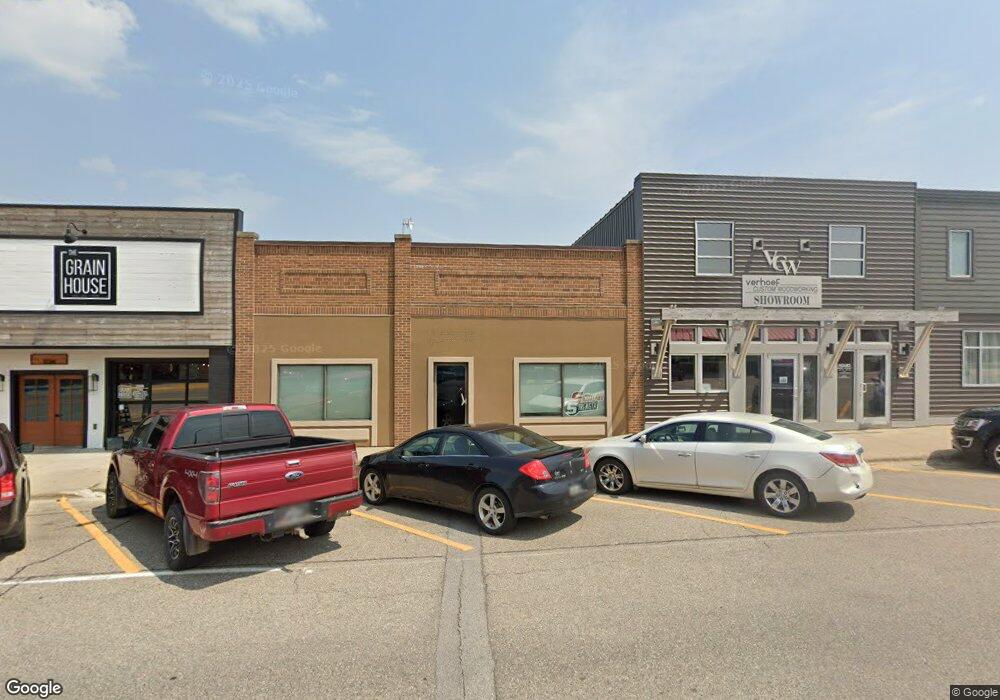
This home is located at 1134 Main St, Hull, IA 51239 and is currently priced at $123,668, approximately $27 per square foot. 1134 Main St is a home located in Sioux County with nearby schools including Boyden-Hull Elementary School, Boyden-Hull High School, and Hull Christian School.
Ownership History
Date
Name
Owned For
Owner Type
Purchase Details
Closed on
Jun 29, 2021
Sold by
Ewoldt Bruce A and Ewoldt Linda R
Bought by
Hom Gh Llc
Current Estimated Value
Home Financials for this Owner
Home Financials are based on the most recent Mortgage that was taken out on this home.
Original Mortgage
$105,000
Outstanding Balance
$79,722
Interest Rate
2.9%
Mortgage Type
Commercial
Purchase Details
Closed on
Oct 28, 2014
Sold by
Sheldahl Beverly K and Sheldahl L
Bought by
Ewoldt Bruce A and Ewoldt Linda R
Create a Home Valuation Report for This Property
The Home Valuation Report is an in-depth analysis detailing your home's value as well as a comparison with similar homes in the area
Home Values in the Area
Average Home Value in this Area
Purchase History
| Date | Buyer | Sale Price | Title Company |
|---|---|---|---|
| Hom Gh Llc | $100,000 | Iowa Abstract & Title | |
| Ewoldt Bruce A | $57,000 | None Available |
Source: Public Records
Mortgage History
| Date | Status | Borrower | Loan Amount |
|---|---|---|---|
| Open | Hom Gh Llc | $105,000 |
Source: Public Records
Tax History Compared to Growth
Tax History
| Year | Tax Paid | Tax Assessment Tax Assessment Total Assessment is a certain percentage of the fair market value that is determined by local assessors to be the total taxable value of land and additions on the property. | Land | Improvement |
|---|---|---|---|---|
| 2025 | $2,796 | $219,300 | $21,150 | $198,150 |
| 2024 | $2,796 | $168,010 | $21,150 | $146,860 |
| 2023 | $2,768 | $168,010 | $21,150 | $146,860 |
| 2022 | $1,194 | $143,950 | $10,580 | $133,370 |
| 2021 | $1,256 | $69,150 | $10,580 | $58,570 |
| 2020 | $1,256 | $69,150 | $10,580 | $58,570 |
| 2019 | $1,272 | $69,150 | $10,580 | $58,570 |
| 2018 | $1,298 | $69,150 | $10,580 | $58,570 |
| 2017 | $1,298 | $69,150 | $10,580 | $58,570 |
| 2014 | $1,196 | $64,370 | $0 | $0 |
Source: Public Records
Map
Nearby Homes