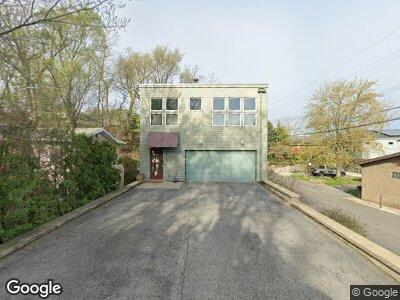
1134 Putnam St Gary, IN 46403
Miller NeighborhoodEstimated Value: $482,000 - $672,000
2
Beds
2
Baths
1,957
Sq Ft
$308/Sq Ft
Est. Value
About This Home
This home is located at 1134 Putnam St, Gary, IN 46403 and is currently estimated at $603,276, approximately $308 per square foot. 1134 Putnam St is a home located in Lake County with nearby schools including Banneker Elementary at Marquette, Gary Middle School, and West Side Leadership Academy.
Ownership History
Date
Name
Owned For
Owner Type
Purchase Details
Closed on
Mar 5, 2021
Sold by
Levi Linda S
Bought by
Kriltchev Inga and Kriltchev Valeri A
Current Estimated Value
Purchase Details
Closed on
Oct 10, 2019
Sold by
Green Leslie R
Bought by
Levi Linda S
Home Financials for this Owner
Home Financials are based on the most recent Mortgage that was taken out on this home.
Original Mortgage
$140,000
Interest Rate
3.4%
Mortgage Type
New Conventional
Purchase Details
Closed on
Feb 18, 2010
Sold by
Putnam Street Partners Llc
Bought by
Levi Linda S and Green Leslie R
Home Financials for this Owner
Home Financials are based on the most recent Mortgage that was taken out on this home.
Original Mortgage
$150,000
Interest Rate
5.11%
Mortgage Type
New Conventional
Purchase Details
Closed on
Jan 5, 2005
Sold by
Lance Courtney B
Bought by
Putnam Street Partners Llc
Create a Home Valuation Report for This Property
The Home Valuation Report is an in-depth analysis detailing your home's value as well as a comparison with similar homes in the area
Home Values in the Area
Average Home Value in this Area
Purchase History
| Date | Buyer | Sale Price | Title Company |
|---|---|---|---|
| Kriltchev Inga | -- | Fidelity National Title Co | |
| Levi Linda S | -- | Community Title Company | |
| Levi Linda S | -- | Ticor Mo | |
| Putnam Street Partners Llc | -- | Chicago Title Insurance Comp |
Source: Public Records
Mortgage History
| Date | Status | Borrower | Loan Amount |
|---|---|---|---|
| Open | Kriltchev Inga | $397,500 | |
| Previous Owner | Levi Linda S | $140,000 | |
| Previous Owner | Levi Linda S | $140,000 | |
| Previous Owner | Levi Linda S | $150,000 | |
| Previous Owner | Putnam Street Partners Llc | $50,000 | |
| Previous Owner | Putnam Street Partners Llc | $296,000 |
Source: Public Records
Tax History Compared to Growth
Tax History
| Year | Tax Paid | Tax Assessment Tax Assessment Total Assessment is a certain percentage of the fair market value that is determined by local assessors to be the total taxable value of land and additions on the property. | Land | Improvement |
|---|---|---|---|---|
| 2024 | $35,276 | $466,800 | $126,800 | $340,000 |
| 2023 | $9,138 | $400,100 | $117,600 | $282,500 |
| 2022 | $9,138 | $356,100 | $48,300 | $307,800 |
| 2021 | $3,866 | $297,300 | $47,600 | $249,700 |
| 2020 | $3,785 | $291,300 | $47,600 | $243,700 |
| 2019 | $2,769 | $272,300 | $45,900 | $226,400 |
| 2018 | $2,602 | $236,600 | $39,500 | $197,100 |
| 2017 | $2,666 | $237,900 | $37,000 | $200,900 |
| 2016 | $2,626 | $237,700 | $37,000 | $200,700 |
| 2014 | $1,649 | $141,100 | $35,300 | $105,800 |
| 2013 | $1,501 | $133,600 | $35,300 | $98,300 |
Source: Public Records
Map
Nearby Homes
- 7704 Maple Ave
- 7641 Locust Ave
- 8045 Oak Ave
- 7840 Indian Boundary
- 7419 Maple Ave
- 7413 Maple Ave
- 7849 Indian Boundary
- 7800 Juniper Ave
- 9217-9221 Juniper Ave
- 7641 Juniper Ave
- 747 N Newton St
- 7219 Maple Ave
- 701 N Randolph St
- 7501 Indian Boundary
- 7423 Indian Boundary
- 7632-7638 Maple Ave
- 8511 Oak Ave
- 1033 N Sullivan St
- 8601-15 Forest Ave
- 631 N Miami St
- 1134 Putnam St
- 1124 Putnam St
- 7817 Lake Shore Dr
- 7819 Lake Shore Dr
- 7825 Lake Shore Dr
- 1125 N Pike St
- 7807 Lake Shore Dr
- 1135 Putnam St
- 7801 Lake Shore Dr
- 7901 Lake Shore Dr
- 1133 Putnam St
- 1127 Putnam St
- 7830 Oak Ave
- 1112-22 Putnam St
- 7838 Oak Ave
- 7907 Lake Shore Dr
- 7820 Oak Ave
- 7915 Lake Shore Dr
- 1150 N Pike St
- 1140 N Randolph St