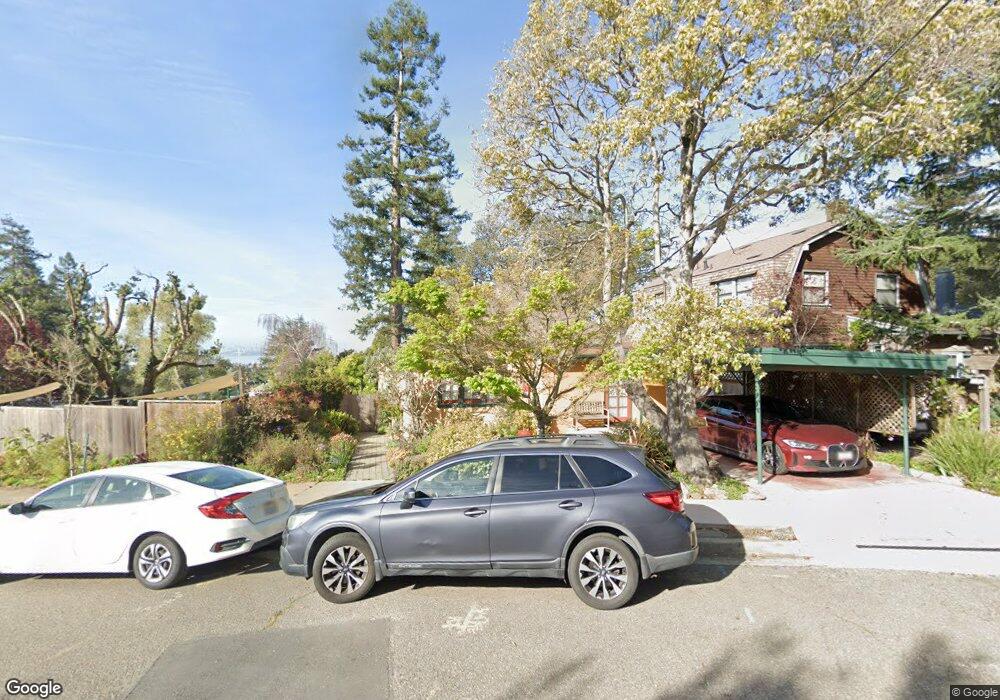
1134 Walnut St Berkeley, CA 94707
Berkeley Hills NeighborhoodEstimated Value: $1,143,000 - $1,889,000
3
Beds
1
Bath
1,835
Sq Ft
$851/Sq Ft
Est. Value
About This Home
This home is located at 1134 Walnut St, Berkeley, CA 94707 and is currently estimated at $1,562,486, approximately $851 per square foot. 1134 Walnut St is a home located in Alameda County with nearby schools including Berkeley Arts Magnet at Whittier School, Cragmont Elementary School, and Washington Elementary School.
Ownership History
Date
Name
Owned For
Owner Type
Purchase Details
Closed on
May 27, 2011
Sold by
Heffner Wendy and Wendy Heffner 1992 Trust
Bought by
Heffner Wendy and Fichtenkort Jean Marie
Current Estimated Value
Purchase Details
Closed on
Feb 24, 2004
Sold by
Heffner Wendy
Bought by
Heffner Wendy and The Wendy Heffner 1992 Trust
Home Financials for this Owner
Home Financials are based on the most recent Mortgage that was taken out on this home.
Original Mortgage
$200,000
Interest Rate
5.62%
Mortgage Type
Credit Line Revolving
Purchase Details
Closed on
Feb 26, 2003
Sold by
Heffner Wendy
Bought by
Heffner Wendy and The Wendy Heffner 1992 Trust
Home Financials for this Owner
Home Financials are based on the most recent Mortgage that was taken out on this home.
Original Mortgage
$300,000
Interest Rate
5.79%
Create a Home Valuation Report for This Property
The Home Valuation Report is an in-depth analysis detailing your home's value as well as a comparison with similar homes in the area
Home Values in the Area
Average Home Value in this Area
Purchase History
| Date | Buyer | Sale Price | Title Company |
|---|---|---|---|
| Heffner Wendy | -- | None Available | |
| Heffner Wendy | -- | Fidelity National Title | |
| Heffner Wendy | -- | Fidelity National Title | |
| Heffner Wendy | -- | First California Title Co | |
| Heffner Wendy | -- | First California Title Co |
Source: Public Records
Mortgage History
| Date | Status | Borrower | Loan Amount |
|---|---|---|---|
| Closed | Heffner Wendy | $200,000 | |
| Closed | Heffner Wendy | $300,000 |
Source: Public Records
Tax History
| Year | Tax Paid | Tax Assessment Tax Assessment Total Assessment is a certain percentage of the fair market value that is determined by local assessors to be the total taxable value of land and additions on the property. | Land | Improvement |
|---|---|---|---|---|
| 2025 | $11,284 | $619,707 | $167,983 | $458,724 |
| 2024 | $11,284 | $607,420 | $164,690 | $449,730 |
| 2023 | $10,976 | $602,374 | $161,461 | $440,913 |
| 2022 | $10,879 | $583,564 | $158,295 | $432,269 |
| 2021 | $10,882 | $571,985 | $155,192 | $423,793 |
| 2020 | $10,254 | $573,050 | $153,601 | $419,449 |
| 2019 | $9,793 | $561,814 | $150,589 | $411,225 |
| 2018 | $9,596 | $550,798 | $147,636 | $403,162 |
| 2017 | $9,251 | $540,001 | $144,742 | $395,259 |
| 2016 | $8,899 | $529,416 | $141,905 | $387,511 |
| 2015 | $8,763 | $521,466 | $139,774 | $381,692 |
| 2014 | $8,621 | $511,253 | $137,036 | $374,217 |
Source: Public Records
Map
Nearby Homes
- 2121 Eunice St
- 1950 Hopkins St
- 2315 Eunice St
- 938 San Benito Rd
- 1004 Cragmont Ave
- 1408 Henry St
- 1444 Walnut St
- 962 Regal Rd
- 1106 Cragmont Ave
- 813 San Diego Rd
- 1425 Martin Luther King jr Way
- 2501 Rose Walk
- 1515 Oxford St Unit 1D
- 1841 Vine St
- 758 Spruce St
- 2686 Shasta Rd
- 777 Cragmont Ave
- 765 San Diego Rd
- 1165 Cragmont Ave
- 1622 Scenic Ave
- 1132 Walnut St
- 1128 Walnut St
- 1141 Shattuck Ave
- 1137 Shattuck Ave
- 1145 Shattuck Ave
- 1148 Walnut St
- 1120 Walnut St
- 1135 Shattuck Ave
- 1149 Shattuck Ave
- 1129 Shattuck Ave
- 1135 Walnut St
- 1154 Walnut St
- 1116 Walnut St
- 1141 Walnut St
- 1151 Shattuck Ave
- 1133 Walnut St
- 1145 Walnut St
- 1127 Shattuck Ave
- 1156 Walnut St
- 1147 Walnut St
Your Personal Tour Guide
Ask me questions while you tour the home.