

11340 N Via Verona Way Fresno, CA 93730
Woodward Park NeighborhoodEstimated payment $4,502/month
Highlights
- Gated Community
- Loft
- Bathtub with Shower
- James S. Fugman Elementary School Rated A
- Formal Dining Room
- Tile Flooring
About This Home
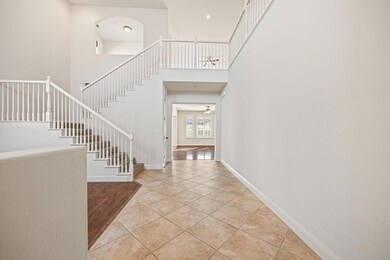
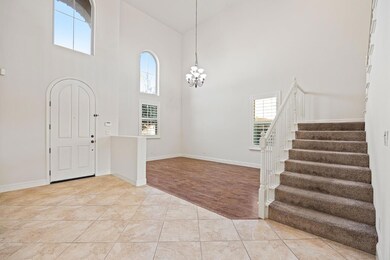
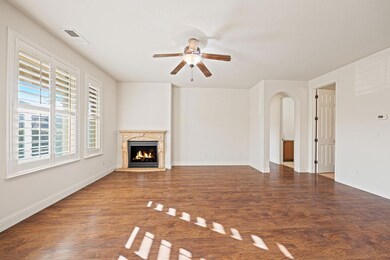
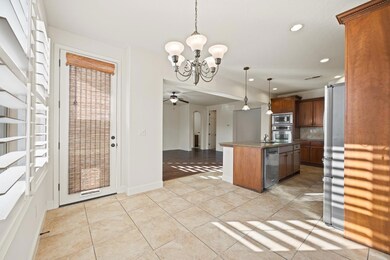
This Granville-built La Mirada home, tucked away in a cul-de-sac within the exclusive Tuscan Bluffs gated community offers 5 bedrooms, 3.5 bathrooms, and 3,044 sqft. It is thoughtfully designed for flexibility.Step through the front door into a bright, open space that flows effortlessly from the formal dining room to the heart of the home. The downstairs guest suite is completely privateperfect for hosting overnight guests or creating a work-from-home setup.Upstairs, you'll find a large multi-use loft, ready to become your go-to spot for movie nights, a home gym, or a creative space. Outside, an oversized side yard offers endless possibilities for outdoor living or entertaining.Located in the prestigious Tuscan Bluffs community, you'll love the convenience of nearby shopping, dining, and parks, all while enjoying the peace and privacy of gated community living.
Home Details
Home Type
- Single Family
Est. Annual Taxes
- $8,850
Year Built
- Built in 2009
Lot Details
- 7,120 Sq Ft Lot
- Lot Dimensions are 80x89
- Property is zoned RS4
HOA Fees
- $58 Monthly HOA Fees
Home Design
- Concrete Foundation
- Tile Roof
- Stucco
Interior Spaces
- 3,044 Sq Ft Home
- 2-Story Property
- Zero Clearance Fireplace
- Formal Dining Room
- Loft
- Laundry in unit
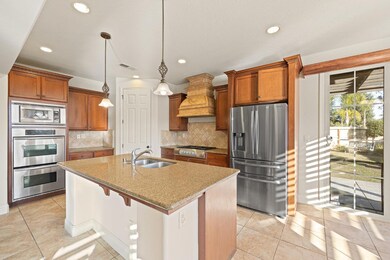
Kitchen
- Microwave
- Dishwasher
- Disposal
Flooring
- Tile
- Vinyl
Bedrooms and Bathrooms
- 5 Bedrooms
- 3.5 Bathrooms
- Bathtub with Shower
- Separate Shower
Utilities
- Central Heating and Cooling System
Community Details
- Gated Community
Map
Home Values in the Area
Average Home Value in this Area
Tax History
| Year | Tax Paid | Tax Assessment Tax Assessment Total Assessment is a certain percentage of the fair market value that is determined by local assessors to be the total taxable value of land and additions on the property. | Land | Improvement |
|---|---|---|---|---|
| 2025 | $8,850 | $697,068 | $208,080 | $488,988 |
| 2023 | $8,500 | $670,000 | $200,000 | $470,000 |
| 2022 | $6,174 | $480,459 | $120,417 | $360,042 |
| 2021 | $6,018 | $471,039 | $118,056 | $352,983 |
| 2020 | $6,051 | $466,210 | $116,846 | $349,364 |
| 2019 | $5,978 | $457,069 | $114,555 | $342,514 |
| 2018 | $5,853 | $448,108 | $112,309 | $335,799 |
| 2017 | $5,763 | $439,322 | $110,107 | $329,215 |
| 2016 | $5,603 | $430,709 | $107,949 | $322,760 |
| 2015 | $5,580 | $424,240 | $106,328 | $317,912 |
| 2014 | $5,538 | $415,931 | $104,246 | $311,685 |
Property History
| Date | Event | Price | List to Sale | Price per Sq Ft |
|---|---|---|---|---|
| 10/07/2025 10/07/25 | Price Changed | $699,000 | -4.9% | $230 / Sq Ft |
| 09/03/2025 09/03/25 | Price Changed | $735,000 | 0.0% | $241 / Sq Ft |
| 09/03/2025 09/03/25 | For Sale | $735,000 | -5.2% | $241 / Sq Ft |
| 07/16/2025 07/16/25 | Off Market | $775,000 | -- | -- |
| 01/30/2025 01/30/25 | For Sale | $775,000 | -- | $255 / Sq Ft |
Purchase History
| Date | Type | Sale Price | Title Company |
|---|---|---|---|
| Grant Deed | -- | New Title Company Name | |
| Grant Deed | $395,000 | First American Title Company | |
| Grant Deed | $449,000 | First American Title Company |
Mortgage History
| Date | Status | Loan Amount | Loan Type |
|---|---|---|---|
| Open | $4,999,000 | New Conventional | |
| Previous Owner | $149,000 | Seller Take Back |
Source: Fresno MLS
MLS Number: 629750
APN: 579-206-02S
Disclaimer: Certain information contained herein is derived from information provided by parties other than Homes.com. All information provided is deemed reliable, but is not guaranteed to be accurate and should be independently verified.
![]() IDX information is provided exclusively for personal, non-commercial use, and may not be used for any purpose other than to identify prospective properties consumers may be interested in purchasing. Information is deemed reliable but not guaranteed.
IDX information is provided exclusively for personal, non-commercial use, and may not be used for any purpose other than to identify prospective properties consumers may be interested in purchasing. Information is deemed reliable but not guaranteed.
- 11336 N Via Ventana Way
- 11352 N Via Ventana Way
- 11319 N Via Napoli Dr
- 11311 N Via Napoli Dr
- 11378 N Via Montessori Dr
- 11337 N Cherry Sage Ave
- 1728 E Green Sage Ave
- 1396 E Via Prato Dr
- 1363 E Via Prato Dr
- 1639 E Clubhouse Dr
- 11335 N Sageberry Way
- 11333 N Garden Sage Ave
- 11293 N Alicante Dr
- 11395 N Monte Vista Way
- 11617 N Bella Verde Ave
- 10824 N Bunkerhill Dr
- 2020 Makenna Dr
- 10678 N Medinah Cir
- 10668 N Oak Hill Cir
- 1138 E Royal Dornoch Ave
- 11233 N Alicante Dr
- 11672 N Via Venitzia Ave
- 10850 Braden Way
- 2249 E Rush Ave
- 10282 N Whitney Ave
- 1903 E Emerald Ave
- 1708 E Chelsea Dr
- 9683 N Sharon Ave
- 1590 E Waterford Ave
- 9663 N Willey Ct
- 1164 E Perrin Ave
- 1242 E Champlain Dr
- 1863 E Ryan Ln
- 9375 N Saybrook Dr
- 1650 E Shepherd Ave
- 9111 N Maple Ave
- 1325 E Foxhill Dr
- 2898 E Pryor Dr
- 2740 E Shepherd Ave
- 8714 N Heartland Way
