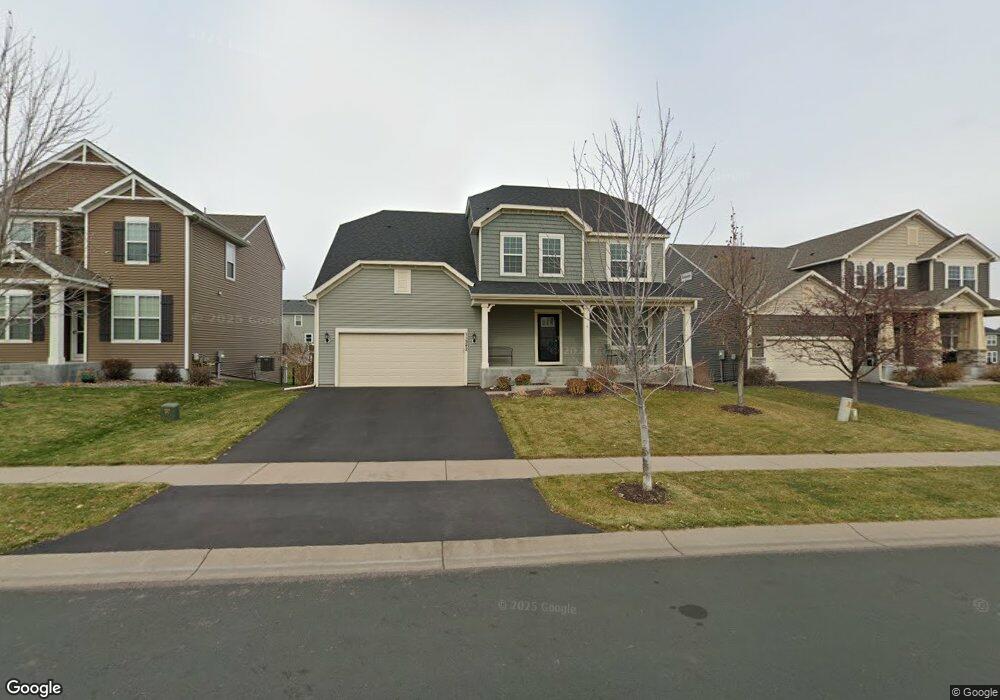
11342 84th Ave N Maple Grove, MN 55369
Estimated Value: $624,000 - $669,000
5
Beds
4
Baths
4,103
Sq Ft
$157/Sq Ft
Est. Value
About This Home
This home is located at 11342 84th Ave N, Maple Grove, MN 55369 and is currently estimated at $646,147, approximately $157 per square foot. 11342 84th Ave N is a home located in Hennepin County with nearby schools including Rice Lake Elementary School, Maple Grove Middle School, and Osseo Senior High School.
Ownership History
Date
Name
Owned For
Owner Type
Purchase Details
Closed on
Sep 10, 2021
Sold by
Arnevik Paul S and Arnevik Christina
Bought by
Davis Timothy and Davis Rhonda
Current Estimated Value
Home Financials for this Owner
Home Financials are based on the most recent Mortgage that was taken out on this home.
Original Mortgage
$402,500
Outstanding Balance
$365,446
Interest Rate
2.8%
Mortgage Type
New Conventional
Estimated Equity
$280,701
Purchase Details
Closed on
Jul 25, 2014
Sold by
Pulte Homes Of Minnesota Llc
Bought by
Arnevik Paul S and Arnevik Christina
Home Financials for this Owner
Home Financials are based on the most recent Mortgage that was taken out on this home.
Original Mortgage
$395,527
Interest Rate
4.2%
Mortgage Type
New Conventional
Create a Home Valuation Report for This Property
The Home Valuation Report is an in-depth analysis detailing your home's value as well as a comparison with similar homes in the area
Home Values in the Area
Average Home Value in this Area
Purchase History
| Date | Buyer | Sale Price | Title Company |
|---|---|---|---|
| Davis Timothy | $575,000 | First Financial Title Agency | |
| Arnevik Paul S | $439,476 | Pgp Title Inc | |
| Davis Timothy Timothy | $575,000 | -- |
Source: Public Records
Mortgage History
| Date | Status | Borrower | Loan Amount |
|---|---|---|---|
| Open | Davis Timothy | $402,500 | |
| Previous Owner | Arnevik Paul S | $395,527 | |
| Closed | Davis Timothy Timothy | $402,500 |
Source: Public Records
Tax History Compared to Growth
Tax History
| Year | Tax Paid | Tax Assessment Tax Assessment Total Assessment is a certain percentage of the fair market value that is determined by local assessors to be the total taxable value of land and additions on the property. | Land | Improvement |
|---|---|---|---|---|
| 2024 | $7,282 | $580,700 | $136,300 | $444,400 |
| 2023 | $6,705 | $559,400 | $123,200 | $436,200 |
| 2022 | $5,835 | $545,700 | $100,400 | $445,300 |
| 2021 | $5,697 | $479,800 | $103,400 | $376,400 |
| 2020 | $5,488 | $458,700 | $95,500 | $363,200 |
| 2019 | $5,855 | $422,300 | $80,300 | $342,000 |
| 2018 | $5,903 | $425,100 | $105,000 | $320,100 |
| 2017 | $6,003 | $410,500 | $120,000 | $290,500 |
| 2016 | $5,954 | $401,600 | $102,000 | $299,600 |
| 2015 | $10,646 | $46,500 | $46,500 | $0 |
| 2014 | -- | $22,300 | $22,300 | $0 |
Source: Public Records
Map
Nearby Homes
- 11712 84th Ave N Unit 309
- 11601 82nd Ave N
- 11486 81st Place N
- 11462 81st Place N
- 11540 81st Place N
- 8406 Jonquil Ln N
- 11879 85th Place N Unit 54
- 8154 Arrowwood Ln N
- 8704 Cottonwood Ln N
- 8764 Cottonwood Ln N
- 11537 88th Ave N
- 11631 88th Ave N
- 8864 Cottonwood Ln N
- 11760 88th Place N
- 14877 106th Ave N
- 8025 Larch Ln N
- 12598 84th Place N
- 8326 Oakview Ct N
- 12509 88th Ave N
- 9058 Goldenrod Ln N
- 11320 84th Ave N
- 11364 84th Ave N
- 11386 84th Ave N
- 11223 84th Place N
- 8385 Balsam Ln N
- 11321 84th Place N
- 8398 Cottonwood Ln N
- 11365 84th Place N
- 11408 84th Ave N
- 11377 84th Place N
- 11343 84th Place N
- 8373 Balsam Ln N
- 8386 Cottonwood Ln N
- 11289 84th Place N
- 11289 11289 84 Place
- 11289 84 Place
- 11420 84th Ave N
- 11409 84th Place N
- 8361 Balsam Ln N
- 8372 Cottonwood Ln N