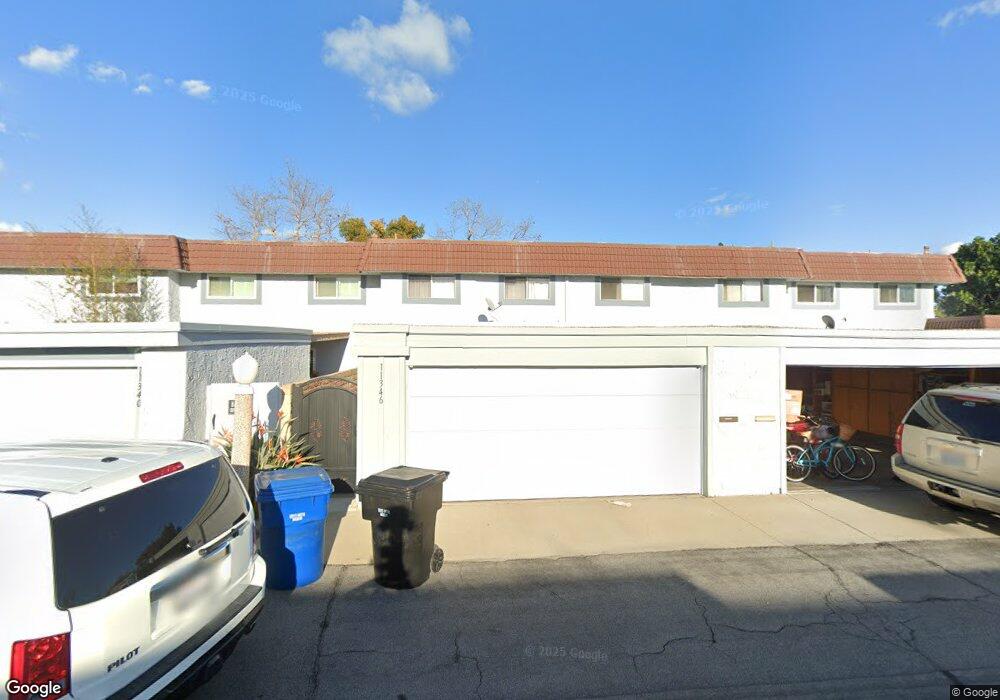
11346 Gull Way Cypress, CA 90630
Estimated Value: $803,748 - $861,000
3
Beds
3
Baths
1,435
Sq Ft
$573/Sq Ft
Est. Value
About This Home
This home is located at 11346 Gull Way, Cypress, CA 90630 and is currently estimated at $822,687, approximately $573 per square foot. 11346 Gull Way is a home located in Orange County with nearby schools including Patton Elementary School, Hilton D. Bell Intermediate School, and Pacifica High School.
Ownership History
Date
Name
Owned For
Owner Type
Purchase Details
Closed on
Mar 26, 2003
Sold by
Roberts Barbara E
Bought by
Roberts Barbara E
Current Estimated Value
Home Financials for this Owner
Home Financials are based on the most recent Mortgage that was taken out on this home.
Original Mortgage
$170,100
Outstanding Balance
$29,831
Interest Rate
5.73%
Estimated Equity
$792,856
Purchase Details
Closed on
Mar 20, 2000
Sold by
Josef Nowak
Bought by
Roberts Barbara E
Home Financials for this Owner
Home Financials are based on the most recent Mortgage that was taken out on this home.
Original Mortgage
$173,000
Interest Rate
8.24%
Create a Home Valuation Report for This Property
The Home Valuation Report is an in-depth analysis detailing your home's value as well as a comparison with similar homes in the area
Home Values in the Area
Average Home Value in this Area
Purchase History
| Date | Buyer | Sale Price | Title Company |
|---|---|---|---|
| Roberts Barbara E | -- | Chicago Title Co | |
| Roberts Barbara E | $183,000 | Lawyers Title Company | |
| Roberts Barbara E | -- | Lawyers Title Company |
Source: Public Records
Mortgage History
| Date | Status | Borrower | Loan Amount |
|---|---|---|---|
| Open | Roberts Barbara E | $170,100 | |
| Closed | Roberts Barbara E | $173,000 |
Source: Public Records
Tax History
| Year | Tax Paid | Tax Assessment Tax Assessment Total Assessment is a certain percentage of the fair market value that is determined by local assessors to be the total taxable value of land and additions on the property. | Land | Improvement |
|---|---|---|---|---|
| 2025 | $3,309 | $281,251 | $146,378 | $134,873 |
| 2024 | $3,309 | $275,737 | $143,508 | $132,229 |
| 2023 | $3,243 | $270,331 | $140,694 | $129,637 |
| 2022 | $3,192 | $265,031 | $137,935 | $127,096 |
| 2021 | $3,160 | $259,835 | $135,231 | $124,604 |
| 2020 | $3,123 | $257,171 | $133,844 | $123,327 |
| 2019 | $3,047 | $252,129 | $131,220 | $120,909 |
| 2018 | $2,997 | $247,186 | $128,647 | $118,539 |
| 2017 | $2,956 | $242,340 | $126,125 | $116,215 |
| 2016 | $2,830 | $237,589 | $123,652 | $113,937 |
| 2015 | $2,793 | $234,021 | $121,795 | $112,226 |
| 2014 | $2,695 | $229,437 | $119,409 | $110,028 |
Source: Public Records
Map
Nearby Homes
- 6842 Amelia Way
- 6837 Amelia Way
- 6844 Southampton Dr
- 11371 Harkers Ct
- 11271 Lowell Ct
- 11474 Shippigan Way
- 6584 Capers Way
- 11268 Morgen Way
- 11580 Panay St
- 6517 Orangewood Ave
- 11254 Jamaica St
- 7336 Ewell Way
- 10860 Jasmine Ln
- 11219 Hood Way
- 7271 Katella Ave Unit 101
- 7271 Katella Ave Unit 99
- 10756 Knott Ave
- 10700 Knott Ave
- 10748 Knott Ave
- 10720 Knott Ave
- 11340 Gull Way
- 11332 Gull Way
- 11352 Gull Way
- 11328 Gull Way
- 11358 Gull Way
- 11364 Gull Way
- 11283 Ellesmere Way
- 11344 Grand Manan Dr
- 11334 Grand Manan Dr
- 11350 Grand Manan Dr
- 11330 Grand Manan Dr
- 11356 Grand Manan Dr
- 11281 Ellesmere Way
- 6854 Amelia Way
- 6850 Amelia Way
- 11362 Grand Manan Dr
- 6858 Amelia Way
- 6846 Amelia Way
- 11279 Ellesmere Way
- 11368 Grand Manan Dr
Your Personal Tour Guide
Ask me questions while you tour the home.