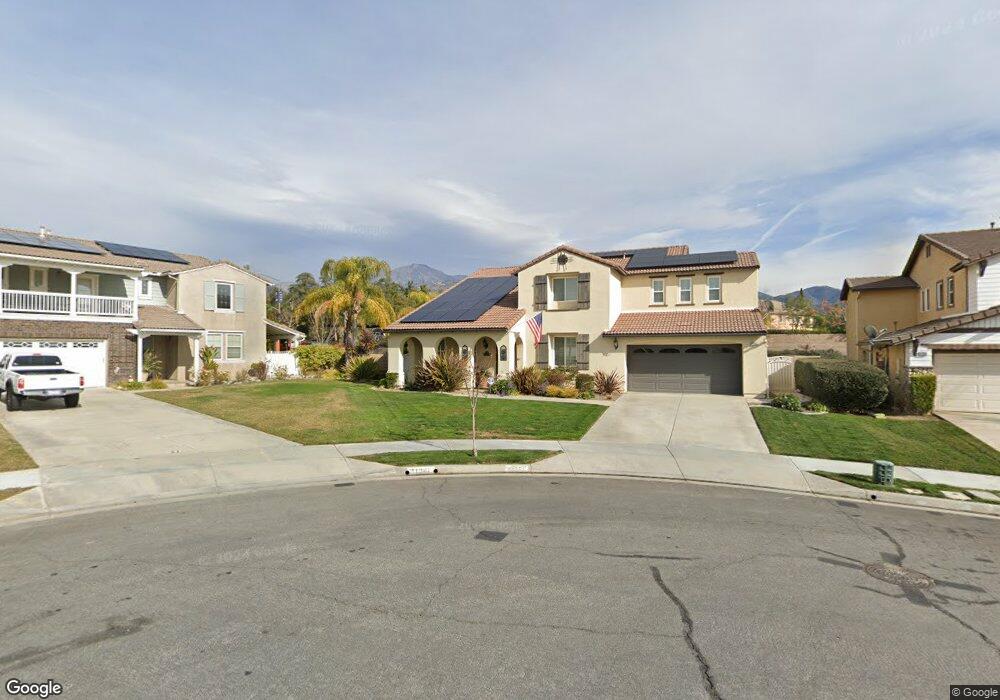
11351 Silverado Way Yucaipa, CA 92399
Estimated Value: $722,000 - $773,063
4
Beds
3
Baths
3,068
Sq Ft
$245/Sq Ft
Est. Value
About This Home
This home is located at 11351 Silverado Way, Yucaipa, CA 92399 and is currently estimated at $751,766, approximately $245 per square foot. 11351 Silverado Way is a home located in San Bernardino County with nearby schools including Chapman Heights Elementary, Park View Middle School, and Yucaipa High School.
Ownership History
Date
Name
Owned For
Owner Type
Purchase Details
Closed on
Nov 4, 2014
Sold by
Burgeson Kevin and Burgeson Dana
Bought by
Coffin Brent M and Coffin Valerie M
Current Estimated Value
Home Financials for this Owner
Home Financials are based on the most recent Mortgage that was taken out on this home.
Original Mortgage
$408,500
Outstanding Balance
$311,999
Interest Rate
3.92%
Mortgage Type
New Conventional
Estimated Equity
$439,767
Purchase Details
Closed on
Apr 12, 2004
Sold by
Trimark Pacific Blossom Ridge Llc
Bought by
Burgeson Kevin and Burgeson Dana
Home Financials for this Owner
Home Financials are based on the most recent Mortgage that was taken out on this home.
Original Mortgage
$357,510
Interest Rate
5.5%
Mortgage Type
Purchase Money Mortgage
Purchase Details
Closed on
Sep 11, 2003
Sold by
Chapman Heights Lp
Bought by
Trimark Pacific Blossom Ridge Llc
Create a Home Valuation Report for This Property
The Home Valuation Report is an in-depth analysis detailing your home's value as well as a comparison with similar homes in the area
Home Values in the Area
Average Home Value in this Area
Purchase History
| Date | Buyer | Sale Price | Title Company |
|---|---|---|---|
| Coffin Brent M | $430,000 | Advantage Title Inc | |
| Burgeson Kevin | $447,000 | First American | |
| Trimark Pacific Blossom Ridge Llc | -- | First American |
Source: Public Records
Mortgage History
| Date | Status | Borrower | Loan Amount |
|---|---|---|---|
| Open | Coffin Brent M | $408,500 | |
| Previous Owner | Burgeson Kevin | $357,510 | |
| Closed | Burgeson Kevin | $89,377 |
Source: Public Records
Tax History Compared to Growth
Tax History
| Year | Tax Paid | Tax Assessment Tax Assessment Total Assessment is a certain percentage of the fair market value that is determined by local assessors to be the total taxable value of land and additions on the property. | Land | Improvement |
|---|---|---|---|---|
| 2025 | $7,838 | $516,795 | $129,198 | $387,597 |
| 2024 | $7,838 | $506,662 | $126,665 | $379,997 |
| 2023 | $7,914 | $496,727 | $124,181 | $372,546 |
| 2022 | $7,970 | $486,987 | $121,746 | $365,241 |
| 2021 | $7,799 | $477,438 | $119,359 | $358,079 |
| 2020 | $7,858 | $472,542 | $118,135 | $354,407 |
| 2019 | $7,696 | $463,277 | $115,819 | $347,458 |
| 2018 | $8,960 | $454,193 | $113,548 | $340,645 |
| 2017 | $10,506 | $445,288 | $111,322 | $333,966 |
| 2016 | $10,454 | $436,557 | $109,139 | $327,418 |
| 2015 | $10,451 | $430,000 | $107,500 | $322,500 |
| 2014 | $6,027 | $381,000 | $114,000 | $267,000 |
Source: Public Records
Map
Nearby Homes
- 34684 Yale Dr
- 11537 Deerfield Dr
- 34440 Fawn Ridge Place
- 34458 Princeton Dr
- 34492 Yale Dr
- 34942 S Serrano Square
- 11452 Pinon Trail
- 34280 Forest Oaks Dr
- 11050 Bryant St Unit 78
- 11050 Bryant St Unit 36
- 11987 Peach Tree Rd
- 10857 Sunnyside Dr
- 35067 Kimberly Ln
- 34113 Castle Pines Dr
- 10776 Sunnyside Dr
- 11425 Bryant St
- 12035 3rd St
- 11692 Bluegrass Rd
- 10684 Lakeview Rd
- 11570 Bryant St
- 11341 Silverado Way
- 11361 Silverado Way
- 11342 Silverado Way
- 34641 Elmwood Ln
- 11371 Silverado Way
- 34643 Elmwood Ln
- 34642 Elmwood Ln
- 11352 Silverado Way
- 11352 Silverado Way
- 34634 Maplewood Ln
- 34596 Fawn Ridge Place
- 34588 Fawn Ridge Place
- 34648 Maplewood Ln
- 34652 Elmwood Ln
- 34653 Elmwood Ln
- 33888 Oak Glen Rd
- 34580 Fawn Ridge Place
- 34603 Fawn Ridge Place
- 34660 Maplewood Ln
- 34662 Elmwood Ln