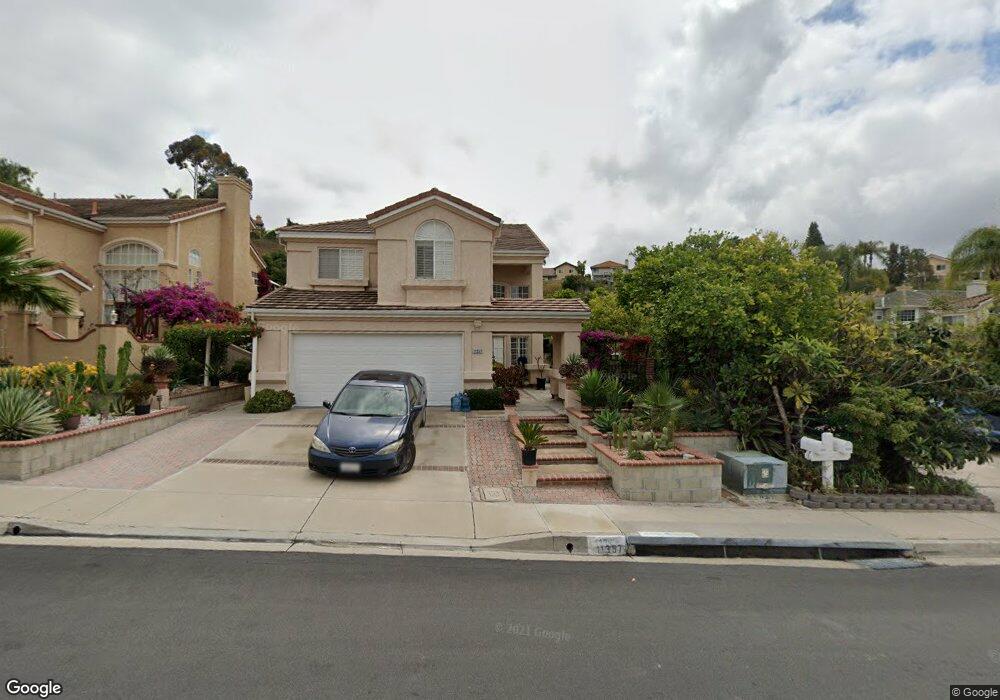
11351 Via Playa de Cortes San Diego, CA 92124
Tierrasanta NeighborhoodEstimated Value: $1,291,000 - $1,406,000
4
Beds
3
Baths
2,113
Sq Ft
$637/Sq Ft
Est. Value
About This Home
This home is located at 11351 Via Playa de Cortes, San Diego, CA 92124 and is currently estimated at $1,346,127, approximately $637 per square foot. 11351 Via Playa de Cortes is a home located in San Diego County with nearby schools including Kumeyaay Elementary School, De Portola Middle School, and Farb Middle School.
Ownership History
Date
Name
Owned For
Owner Type
Purchase Details
Closed on
Mar 2, 2018
Sold by
Ha Cindy Thuy and Huynh Kevin Phuong
Bought by
Ha Cindy Thuy and Huynh Kevin Phuong
Current Estimated Value
Purchase Details
Closed on
Mar 31, 1994
Sold by
Cusick Ronald M
Bought by
Huynh Phuong Thanh and Ha Cindy Thuy
Home Financials for this Owner
Home Financials are based on the most recent Mortgage that was taken out on this home.
Original Mortgage
$236,000
Interest Rate
8.1%
Purchase Details
Closed on
Feb 3, 1994
Sold by
Cusick Susan M
Bought by
Cusick Ronald M
Home Financials for this Owner
Home Financials are based on the most recent Mortgage that was taken out on this home.
Original Mortgage
$236,000
Interest Rate
8.1%
Purchase Details
Closed on
Jun 25, 1991
Create a Home Valuation Report for This Property
The Home Valuation Report is an in-depth analysis detailing your home's value as well as a comparison with similar homes in the area
Home Values in the Area
Average Home Value in this Area
Purchase History
| Date | Buyer | Sale Price | Title Company |
|---|---|---|---|
| Ha Cindy Thuy | -- | None Available | |
| Huynh Phuong Thanh | $295,000 | North American Title Company | |
| Cusick Ronald M | -- | -- | |
| -- | $279,800 | -- |
Source: Public Records
Mortgage History
| Date | Status | Borrower | Loan Amount |
|---|---|---|---|
| Previous Owner | Huynh Phuong Thanh | $236,000 |
Source: Public Records
Tax History Compared to Growth
Tax History
| Year | Tax Paid | Tax Assessment Tax Assessment Total Assessment is a certain percentage of the fair market value that is determined by local assessors to be the total taxable value of land and additions on the property. | Land | Improvement |
|---|---|---|---|---|
| 2025 | $6,086 | $501,382 | $161,246 | $340,136 |
| 2024 | $6,086 | $491,552 | $158,085 | $333,467 |
| 2023 | $5,948 | $481,915 | $154,986 | $326,929 |
| 2022 | $5,784 | $472,467 | $151,948 | $320,519 |
| 2021 | $5,738 | $463,204 | $148,969 | $314,235 |
| 2020 | $5,668 | $458,455 | $147,442 | $311,013 |
| 2019 | $5,565 | $449,466 | $144,551 | $304,915 |
| 2018 | $5,204 | $440,654 | $141,717 | $298,937 |
| 2017 | $5,079 | $432,015 | $138,939 | $293,076 |
| 2016 | $4,996 | $423,545 | $136,215 | $287,330 |
| 2015 | $4,920 | $417,184 | $134,169 | $283,015 |
| 2014 | $4,842 | $409,013 | $131,541 | $277,472 |
Source: Public Records
Map
Nearby Homes
- 4755 Mayita Way
- 5238 Camino Playa Malaga
- 4989 Corte Playa Encino
- 11350 Camino Playa Cancun Unit 3
- 4734 Ocana Place Unit 1
- 11370 Camino Playa Cancun Unit 3
- 10908 Avenida Playa Veracruz
- 11136 Portobelo Dr
- 11048 Portobelo Dr
- 11056 Portobelo Dr
- 11116 Portobelo Dr
- 11080 Portobelo Dr
- 11086 Portobelo Dr Unit 125
- 4375 Calle de Vida
- 6161 Calle Mariselda Unit 408
- 10828 Lamentin Ct Unit 313
- 10812 Lamentin Ct Unit 312
- 10834 Caravelle Place
- 10889 Lamentin Ct
- 6140 Calle Mariselda Unit 102
- 11357 Via Playa de Cortes
- 11365 Via Playa de Cortes
- 11385 Corte Playa de Cortes
- 11373 Via Playa de Cortes
- 11389 Corte Playa de Cortes
- 11350 Via Playa de Cortes
- 11358 Via Playa de Cortes
- 11342 Via Playa de Cortes
- 11366 Via Playa de Cortes
- 11381 Via Playa de Cortes
- 11334 Via Playa de Cortes
- 11393 Corte Playa de Cortes
- 11374 Via Playa de Cortes
- 11333 Via Playa de Cortes
- 11326 Via Playa de Cortes
- 11382 Via Playa de Cortes
- 11318 Via Playa de Cortes
- 11325 Via Playa de Cortes Unit 1
- 11390 Via Playa de Cortes
- 11397 Via Playa de Cortes