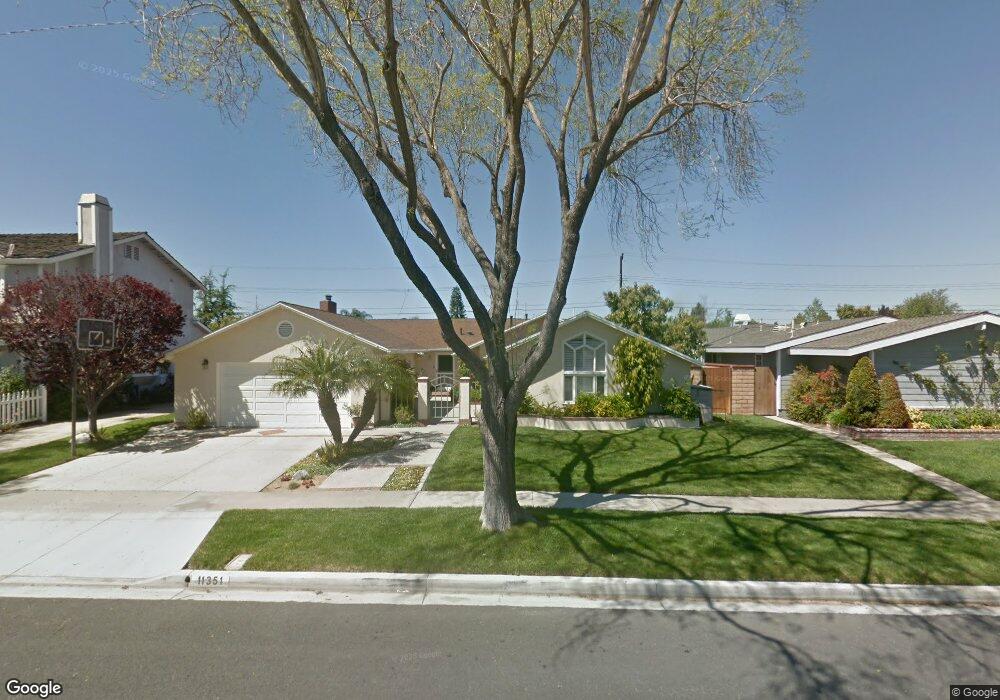
11351 Weatherby Rd Los Alamitos, CA 90720
Rossmoor NeighborhoodEstimated Value: $1,633,529 - $2,187,000
3
Beds
2
Baths
2,576
Sq Ft
$785/Sq Ft
Est. Value
About This Home
This home is located at 11351 Weatherby Rd, Los Alamitos, CA 90720 and is currently estimated at $2,022,632, approximately $785 per square foot. 11351 Weatherby Rd is a home located in Orange County with nearby schools including Rossmoor Elementary School, Jack L. Weaver Elementary School, and Oak Middle School.
Ownership History
Date
Name
Owned For
Owner Type
Purchase Details
Closed on
Mar 5, 2021
Sold by
Kleinberg Richard F and Kleinberg Janis A
Bought by
Kleinberg Richard F and Kleinberg Janis A
Current Estimated Value
Home Financials for this Owner
Home Financials are based on the most recent Mortgage that was taken out on this home.
Original Mortgage
$260,100
Interest Rate
2.7%
Mortgage Type
New Conventional
Purchase Details
Closed on
Aug 13, 2016
Sold by
Kleinberg Richard F and Kleinberg Janis A
Bought by
Kleinberg Richard F and Kleinberg Janis A
Home Financials for this Owner
Home Financials are based on the most recent Mortgage that was taken out on this home.
Original Mortgage
$405,500
Interest Rate
3.42%
Mortgage Type
New Conventional
Purchase Details
Closed on
Dec 28, 2005
Sold by
Kleinberg Richard F and Kleinberg Janis A
Bought by
Kleinberg Richard F and Kleinberg Janis A
Create a Home Valuation Report for This Property
The Home Valuation Report is an in-depth analysis detailing your home's value as well as a comparison with similar homes in the area
Home Values in the Area
Average Home Value in this Area
Purchase History
| Date | Buyer | Sale Price | Title Company |
|---|---|---|---|
| Kleinberg Richard F | -- | Amrock Llc | |
| Kleinberg Richard F | -- | Amrock Llc | |
| Kleinberg Richard F | -- | None Available | |
| Kleinberg Richard F | -- | None Available | |
| Kleinberg Richard F | -- | -- |
Source: Public Records
Mortgage History
| Date | Status | Borrower | Loan Amount |
|---|---|---|---|
| Closed | Kleinberg Richard F | $260,100 | |
| Closed | Kleinberg Richard F | $405,500 |
Source: Public Records
Tax History Compared to Growth
Tax History
| Year | Tax Paid | Tax Assessment Tax Assessment Total Assessment is a certain percentage of the fair market value that is determined by local assessors to be the total taxable value of land and additions on the property. | Land | Improvement |
|---|---|---|---|---|
| 2025 | $7,835 | $673,348 | $467,814 | $205,534 |
| 2024 | $7,835 | $660,146 | $458,642 | $201,504 |
| 2023 | $7,653 | $647,202 | $449,649 | $197,553 |
| 2022 | $7,620 | $634,512 | $440,832 | $193,680 |
| 2021 | $7,454 | $622,071 | $432,188 | $189,883 |
| 2020 | $7,475 | $615,693 | $427,757 | $187,936 |
| 2019 | $7,271 | $603,621 | $419,370 | $184,251 |
| 2018 | $6,983 | $591,786 | $411,147 | $180,639 |
| 2017 | $6,836 | $580,183 | $403,085 | $177,098 |
| 2016 | $6,706 | $568,807 | $395,181 | $173,626 |
| 2015 | $6,654 | $560,263 | $389,245 | $171,018 |
| 2014 | $6,426 | $549,289 | $381,621 | $167,668 |
Source: Public Records
Map
Nearby Homes
- 11385 Baskerville Rd
- 3312 Kenilworth Dr
- 3391 Rossmoor Way
- 3311 Rossmoor Way
- 3701 La Colmena Way
- 3122 Ruth Elaine Dr
- 11291 Wembley Rd
- 3804 Howard Ave
- 3802 Howard Ave
- 11771 Paseo Bonita
- 3845 Farquhar Ave
- 3845 Farquhar Ave Unit 110
- 10842 Pine St
- 3272 Saint Albans Dr
- 11862 Paseo Bonita
- 3162 Inverness Dr
- 10681 Oak St Unit 29
- 3342 Bradbury Rd Unit 34
- 10572 Acorn Place
- 12100 Montecito Rd Unit 49
- 11341 Weatherby Rd
- 11361 Weatherby Rd
- 11352 Wallingsford Rd
- 11342 Wallingsford Rd
- 11362 Wallingsford Rd
- 11331 Weatherby Rd
- 11371 Weatherby Rd
- 11352 Weatherby Rd
- 11332 Wallingsford Rd
- 11372 Wallingsford Rd
- 11342 Weatherby Rd
- 11362 Weatherby Rd
- 11321 Weatherby Rd
- 11391 Weatherby Rd
- 11332 Weatherby Rd
- 11372 Weatherby Rd
- 11322 Wallingsford Rd
- 11392 Wallingsford Rd
- 11322 Weatherby Rd
- 11392 Weatherby Rd