Estimated Value: $291,000 - $390,000
2
Beds
1
Bath
947
Sq Ft
$381/Sq Ft
Est. Value
About This Home
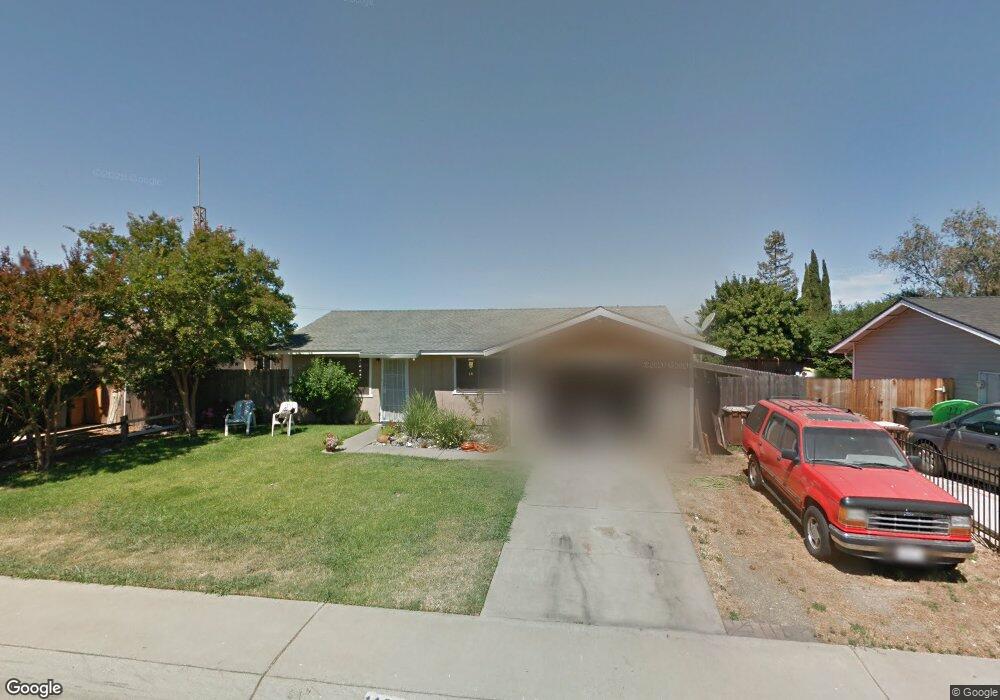
This home is located at 1136 Creekside Way, Galt, CA 95632 and is currently estimated at $361,003, approximately $381 per square foot. 1136 Creekside Way is a home located in Sacramento County with nearby schools including Valley Oaks Elementary School, Robert L. McCaffrey Middle School, and Galt High School.
Ownership History
Date
Name
Owned For
Owner Type
Purchase Details
Closed on
Mar 20, 2025
Sold by
Wilburn Family Revocable Trust and Howell Edward
Bought by
Martin Lori Jean
Current Estimated Value
Purchase Details
Closed on
Dec 2, 2002
Sold by
Upson Jason and Upson Michelle
Bought by
Wilburn Homer Eugene and Wilburn Lorraine V
Purchase Details
Closed on
Dec 26, 2000
Sold by
Wilburn H E and Wilburn Lorraine V
Bought by
Upson Jason and Upson Michelle
Home Financials for this Owner
Home Financials are based on the most recent Mortgage that was taken out on this home.
Original Mortgage
$101,000
Interest Rate
7.71%
Mortgage Type
Seller Take Back
Purchase Details
Closed on
Jul 31, 2000
Sold by
Wilburn H E and Wilburn Lorraine V
Bought by
Wilburn Homer Eugene and Wilburn Lorraine V
Create a Home Valuation Report for This Property
The Home Valuation Report is an in-depth analysis detailing your home's value as well as a comparison with similar homes in the area
Home Values in the Area
Average Home Value in this Area
Purchase History
| Date | Buyer | Sale Price | Title Company |
|---|---|---|---|
| Martin Lori Jean | -- | None Listed On Document | |
| Martin Lori Jean | -- | None Listed On Document | |
| Wilburn Homer Eugene | -- | Chicago Title Company | |
| Upson Jason | $111,000 | Alliance Title Company | |
| Wilburn Homer Eugene | -- | -- |
Source: Public Records
Mortgage History
| Date | Status | Borrower | Loan Amount |
|---|---|---|---|
| Previous Owner | Upson Jason | $101,000 |
Source: Public Records
Tax History Compared to Growth
Tax History
| Year | Tax Paid | Tax Assessment Tax Assessment Total Assessment is a certain percentage of the fair market value that is determined by local assessors to be the total taxable value of land and additions on the property. | Land | Improvement |
|---|---|---|---|---|
| 2025 | $2,175 | $197,674 | $57,921 | $139,753 |
| 2024 | $2,175 | $193,799 | $56,786 | $137,013 |
| 2023 | $2,139 | $190,000 | $55,673 | $134,327 |
| 2022 | $2,053 | $186,276 | $54,582 | $131,694 |
| 2021 | $2,055 | $182,624 | $53,512 | $129,112 |
| 2020 | $2,038 | $180,753 | $52,964 | $127,789 |
| 2019 | $1,987 | $177,210 | $51,926 | $125,284 |
| 2018 | $1,984 | $173,736 | $50,908 | $122,828 |
| 2017 | $1,907 | $170,330 | $49,910 | $120,420 |
| 2016 | $1,832 | $166,991 | $48,932 | $118,059 |
| 2015 | $1,697 | $157,778 | $46,231 | $111,547 |
| 2014 | $1,584 | $144,751 | $42,414 | $102,337 |
Source: Public Records
Map
Nearby Homes
- 1132 Creekside Way
- 1140 Creekside Way
- 1135 Tudor St
- 1131 Tudor St
- 1139 Tudor St
- 1128 Creekside Way
- 1137 Creekside Way
- 1127 Tudor St
- 1133 Creekside Way
- 1141 Creekside Way
- 1124 Creekside Way
- 1129 Creekside Way
- 1123 Tudor St
- 1136 Tudor St
- 1125 Creekside Way
- 1132 Tudor St
- 1140 Tudor St
- 1120 Creekside Way
- 1119 Tudor St
- 1128 Tudor St