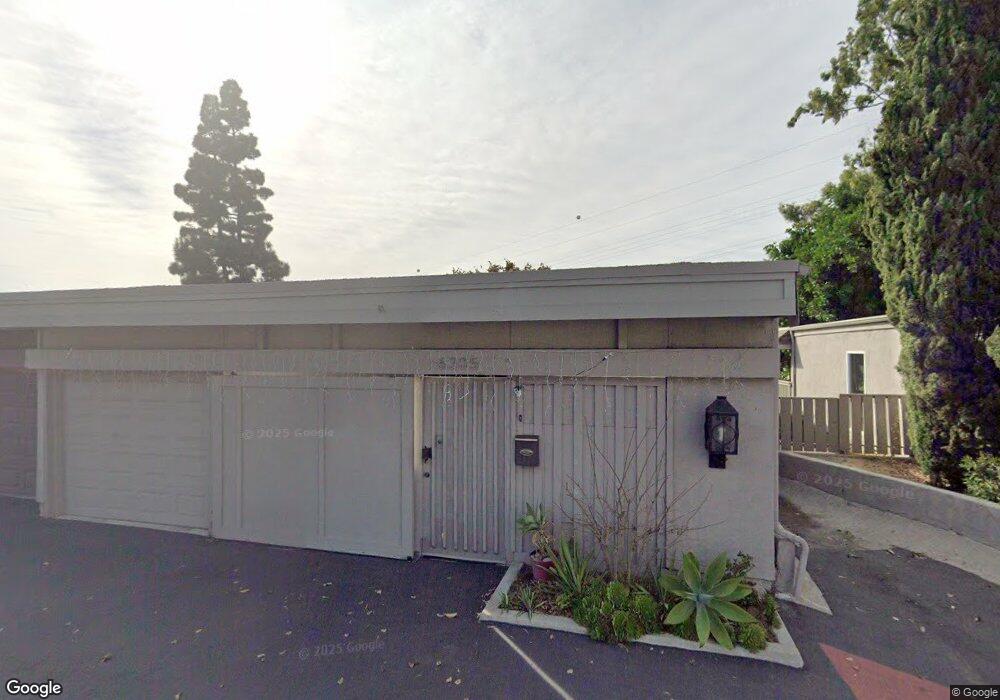
1136 Nimbus Ln San Diego, CA 92110
Morena NeighborhoodEstimated Value: $641,673 - $789,000
2
Beds
2
Baths
1,058
Sq Ft
$674/Sq Ft
Est. Value
About This Home
This home is located at 1136 Nimbus Ln, San Diego, CA 92110 and is currently estimated at $712,668, approximately $673 per square foot. 1136 Nimbus Ln is a home located in San Diego County with nearby schools including Carson Elementary School, Montgomery Middle School, and Empower Language Academy.
Ownership History
Date
Name
Owned For
Owner Type
Purchase Details
Closed on
Jun 16, 2009
Sold by
Lion Financial Inc
Bought by
Kulungowski Alexander Ward
Current Estimated Value
Purchase Details
Closed on
May 4, 2009
Sold by
Hom Olivia
Bought by
Lion Financial
Purchase Details
Closed on
Jun 3, 2004
Sold by
Mccluskey David and Mccluskey Barbara
Bought by
Hom Olivia
Home Financials for this Owner
Home Financials are based on the most recent Mortgage that was taken out on this home.
Original Mortgage
$352,800
Interest Rate
5.12%
Mortgage Type
Purchase Money Mortgage
Purchase Details
Closed on
Aug 1, 1997
Sold by
Mccluskey Barbara Lewis and Mccluskey Barbara E
Bought by
Mccluskey David Lewis and Mccluskey Barbara E
Purchase Details
Closed on
Sep 11, 1995
Sold by
Walsh Barbara E
Bought by
Walsh Barbara E
Purchase Details
Closed on
Dec 5, 1986
Create a Home Valuation Report for This Property
The Home Valuation Report is an in-depth analysis detailing your home's value as well as a comparison with similar homes in the area
Home Values in the Area
Average Home Value in this Area
Purchase History
| Date | Buyer | Sale Price | Title Company |
|---|---|---|---|
| Kulungowski Alexander Ward | $335,000 | Equity Title San Diego | |
| Lion Financial | -- | None Available | |
| Hom Olivia | $441,000 | Commonwealth Land Title Co | |
| Mccluskey David Lewis | -- | -- | |
| Mccluskey David Lewis | -- | -- | |
| Walsh Barbara E | -- | -- | |
| -- | $115,000 | -- |
Source: Public Records
Mortgage History
| Date | Status | Borrower | Loan Amount |
|---|---|---|---|
| Previous Owner | Hom Olivia | $352,800 | |
| Closed | Hom Olivia | $88,200 |
Source: Public Records
Tax History Compared to Growth
Tax History
| Year | Tax Paid | Tax Assessment Tax Assessment Total Assessment is a certain percentage of the fair market value that is determined by local assessors to be the total taxable value of land and additions on the property. | Land | Improvement |
|---|---|---|---|---|
| 2025 | $5,226 | $431,383 | $238,227 | $193,156 |
| 2024 | $5,226 | $422,925 | $233,556 | $189,369 |
| 2023 | $5,025 | $414,633 | $228,977 | $185,656 |
| 2022 | $4,890 | $406,504 | $224,488 | $182,016 |
| 2021 | $4,855 | $398,535 | $220,087 | $178,448 |
| 2020 | $4,795 | $394,450 | $217,831 | $176,619 |
| 2019 | $4,708 | $386,716 | $213,560 | $173,156 |
| 2018 | $4,401 | $379,134 | $209,373 | $169,761 |
| 2017 | $4,295 | $371,701 | $205,268 | $166,433 |
| 2016 | $4,225 | $364,414 | $201,244 | $163,170 |
| 2015 | $4,162 | $358,942 | $198,222 | $160,720 |
| 2014 | $4,095 | $351,912 | $194,340 | $157,572 |
Source: Public Records
Map
Nearby Homes
- 6273 Caminito Juanico
- 6028 Gaines St
- 6224 Caminito Juanico
- 5987 Gaines St
- 5983 Gaines St
- 6038 Cirrus St
- 6266 Caminito Telmo
- 6226 Caminito Andreta
- 6055 Cirrus St
- 6332 Caminito Telmo
- 6416 Friars Rd Unit 101
- 6314 Friars Rd Unit 102
- 6314 Friars Rd Unit 109
- 6406 Friars Rd Unit 133
- 6304 Friars Rd Unit 234
- 6202 Friars Rd Unit 306
- 6304 Friars Rd Unit 242
- 6202 Friars Rd Unit 215
- 6206 Caminito Salado
- 5805 Friars Rd Unit 2405
- 6076 Cumulus Ln
- 6082 Cirrus St
- 6092 Cumulus Ln
- 6086 Cumulus Ln
- 6072 Cumulus Ln
- 6083 Cumulus Ln
- 1144 Nimbus Ln
- 1146 Nimbus Ln
- 1134 Nimbus Ln
- 1114 Nimbus Ln
- 1116 Nimbus Ln
- 1117 Nimbus Ln
- 6079 Cumulus Ln
- 6074 Cirrus St
- 6094 Cumulus Ln
- 6096 Cumulus Ln Unit 70
- 6082 Cumulus Ln
- 6081 Cumulus Ln
- 6073 Cumulus Ln Unit 61
- 6075 Cumulus Ln