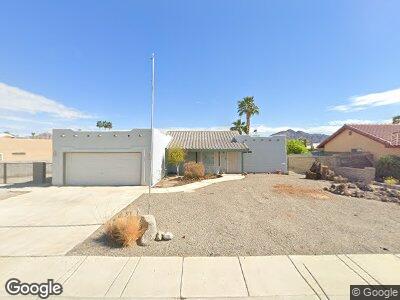
11361 S Viewpointe Way Yuma, AZ 85367
Fortuna Foothills NeighborhoodEstimated Value: $391,886 - $486,000
3
Beds
2
Baths
1,497
Sq Ft
$298/Sq Ft
Est. Value
About This Home
This home is located at 11361 S Viewpointe Way, Yuma, AZ 85367 and is currently estimated at $445,722, approximately $297 per square foot. 11361 S Viewpointe Way is a home located in Yuma County with nearby schools including Sunrise Elementary School, Ron Watson Middle School, and Gila Ridge High School.
Ownership History
Date
Name
Owned For
Owner Type
Purchase Details
Closed on
Jul 14, 2021
Sold by
Vroeman Dolores P and Billesbach James E
Bought by
Vrooman Dolores P and Dolores P Vrooman Revocable Tr
Current Estimated Value
Purchase Details
Closed on
Aug 20, 2013
Sold by
Billesbach James E and Vrooman Dolores P
Bought by
Vrooman Dolores P and Billesbach James E
Purchase Details
Closed on
Feb 28, 2004
Sold by
Dones Dorthea M
Bought by
Billesbach James E and Vrooman Dolores P
Home Financials for this Owner
Home Financials are based on the most recent Mortgage that was taken out on this home.
Original Mortgage
$110,000
Interest Rate
5.69%
Mortgage Type
New Conventional
Purchase Details
Closed on
Jul 21, 2001
Sold by
Dones James R and Dones Dorthea M
Bought by
Dones James R and Dones Dorthea M
Purchase Details
Closed on
Feb 17, 2000
Sold by
Howard Brenda
Bought by
Dones James R and Dones Dorthea M
Create a Home Valuation Report for This Property
The Home Valuation Report is an in-depth analysis detailing your home's value as well as a comparison with similar homes in the area
Home Values in the Area
Average Home Value in this Area
Purchase History
| Date | Buyer | Sale Price | Title Company |
|---|---|---|---|
| Vrooman Dolores P | -- | None Available | |
| Vrooman Dolores P | -- | None Available | |
| Billesbach James E | $182,500 | Citizens Title | |
| Dones James R | -- | -- | |
| Dones James R | $113,000 | Yuma Title |
Source: Public Records
Mortgage History
| Date | Status | Borrower | Loan Amount |
|---|---|---|---|
| Previous Owner | Billesbach James E | $110,000 |
Source: Public Records
Tax History Compared to Growth
Tax History
| Year | Tax Paid | Tax Assessment Tax Assessment Total Assessment is a certain percentage of the fair market value that is determined by local assessors to be the total taxable value of land and additions on the property. | Land | Improvement |
|---|---|---|---|---|
| 2025 | $1,904 | $23,041 | $4,215 | $18,826 |
| 2024 | $1,882 | $21,944 | $4,130 | $17,814 |
| 2023 | $1,882 | $20,899 | $4,533 | $16,366 |
| 2022 | $1,819 | $19,904 | $4,823 | $15,081 |
| 2021 | $1,948 | $18,955 | $5,401 | $13,554 |
| 2020 | $1,762 | $18,053 | $3,600 | $14,453 |
| 2019 | $1,816 | $17,944 | $3,593 | $14,351 |
| 2018 | $1,734 | $17,089 | $3,506 | $13,583 |
| 2017 | $1,660 | $17,089 | $3,506 | $13,583 |
| 2016 | $1,777 | $16,046 | $4,500 | $11,546 |
| 2015 | -- | $15,691 | $4,175 | $11,516 |
| 2014 | -- | $16,389 | $4,500 | $11,889 |
Source: Public Records
Map
Nearby Homes
- 11465 S Ironwood Dr
- 13650 N Frontage Rd Unit 110
- 13650 N Frontage Rd Unit 282
- 13650 N Frontage Rd Unit 55
- 13650 N Frontage Rd Unit 507
- 13502 N Frontage Rd Unit 481
- 13502 N Frontage Rd Unit 439
- 13502 N Frontage Rd Unit 96
- 13502 N Frontage Rd Unit 88
- 13502 N Frontage Rd Unit 448
- 11345 S Sandy Ln
- 13215 S Frontage Rd
- 11743 S El Camino Del Diablo
- 11550 S Foothills Blvd
- 13180 E 39th St
- 11891 S El Camino Del Diablo
- 10779 S Avenue 14 E
- 14204 E Fortuna Palms Place
- 12175 S Ironwood Dr
- 12731 E 38th St
- 11361 S Viewpointe Way
- 11371 S Viewpointe Way
- 11341 S Viewpointe Way
- 13505 E 34th Place
- 11331 S Viewpointe Way
- 11381 S Viewpointe Way
- 11352 S Viewpointe Ave
- 11370 S Viewpointe Way
- 11350 S Viewpointe Way
- 13465 E 34th Place
- 11380 S Viewpointe Way
- 11391 S Viewpointe Way
- 11342 S Viewpointe Ave
- 13500 E 34th Place
- 11390 S Viewpointe Way
- 11390 S Viewpointe Way
- 13455 E 34th Place
- 13480 E 34th Place
- 13510 E 34th Place
- 13460 E 34th Place