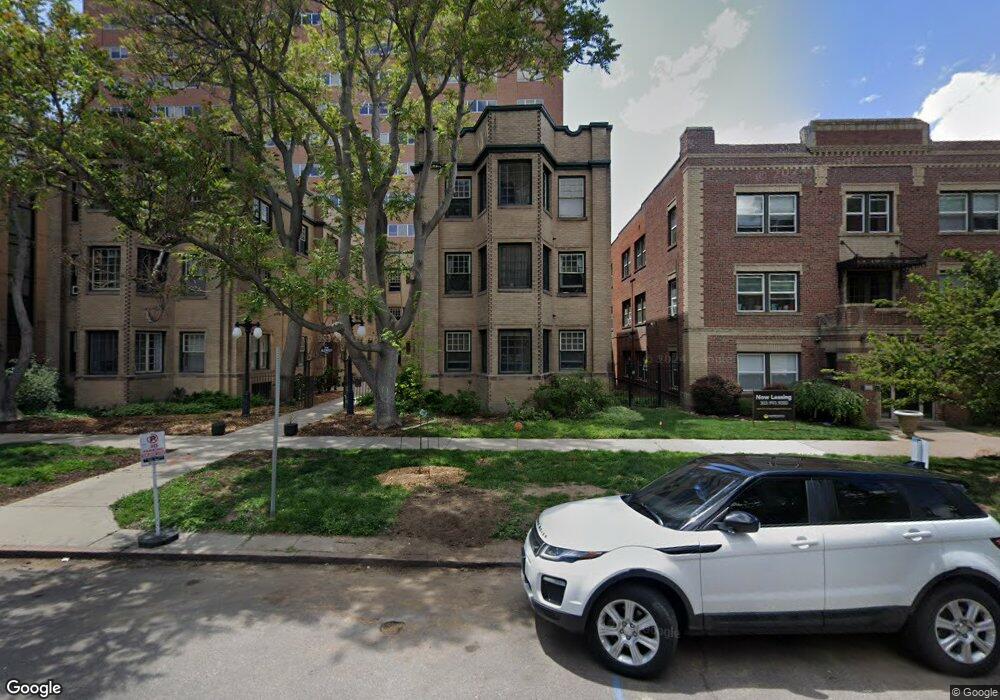
1137 Sherman St Unit 10 Denver, CO 80203
Capitol Hill NeighborhoodEstimated Value: $248,000 - $297,000
1
Bed
1
Bath
675
Sq Ft
$391/Sq Ft
Est. Value
About This Home
This home is located at 1137 Sherman St Unit 10, Denver, CO 80203 and is currently estimated at $263,621, approximately $390 per square foot. 1137 Sherman St Unit 10 is a home located in Denver County with nearby schools including Dora Moore ECE-8 School, Kepner Beacon Middle School, and West High School.
Ownership History
Date
Name
Owned For
Owner Type
Purchase Details
Closed on
May 30, 2013
Sold by
Jeffords Gary M and Gonzalez Tornquist Maria Cristina
Bought by
Pangean Resources Llc
Current Estimated Value
Purchase Details
Closed on
May 4, 2007
Sold by
Barton Jennifer
Bought by
Jeffords Gary M and Gonzalez Tornquist Maria Cristina
Home Financials for this Owner
Home Financials are based on the most recent Mortgage that was taken out on this home.
Original Mortgage
$111,200
Interest Rate
6.13%
Mortgage Type
Purchase Money Mortgage
Purchase Details
Closed on
Aug 3, 1998
Sold by
Blenheim Court Llc
Bought by
Barton Jennifer
Home Financials for this Owner
Home Financials are based on the most recent Mortgage that was taken out on this home.
Original Mortgage
$72,300
Interest Rate
7%
Create a Home Valuation Report for This Property
The Home Valuation Report is an in-depth analysis detailing your home's value as well as a comparison with similar homes in the area
Home Values in the Area
Average Home Value in this Area
Purchase History
| Date | Buyer | Sale Price | Title Company |
|---|---|---|---|
| Pangean Resources Llc | $120,000 | Land Title Guarantee Company | |
| Jeffords Gary M | $139,000 | Landamerica | |
| Barton Jennifer | $76,186 | -- |
Source: Public Records
Mortgage History
| Date | Status | Borrower | Loan Amount |
|---|---|---|---|
| Previous Owner | Jeffords Gary M | $111,200 | |
| Previous Owner | Barton Jennifer | $72,300 |
Source: Public Records
Tax History Compared to Growth
Tax History
| Year | Tax Paid | Tax Assessment Tax Assessment Total Assessment is a certain percentage of the fair market value that is determined by local assessors to be the total taxable value of land and additions on the property. | Land | Improvement |
|---|---|---|---|---|
| 2024 | $1,245 | $15,720 | $320 | $15,400 |
| 2023 | $1,218 | $15,720 | $320 | $15,400 |
| 2022 | $1,227 | $15,430 | $3,590 | $11,840 |
| 2021 | $1,184 | $15,870 | $3,690 | $12,180 |
| 2020 | $1,226 | $16,520 | $2,950 | $13,570 |
| 2019 | $1,191 | $16,520 | $2,950 | $13,570 |
| 2018 | $1,006 | $13,000 | $2,670 | $10,330 |
| 2017 | $1,003 | $13,000 | $2,670 | $10,330 |
| 2016 | $860 | $10,550 | $1,234 | $9,316 |
| 2015 | $824 | $10,550 | $1,234 | $9,316 |
| 2014 | $740 | $8,910 | $1,640 | $7,270 |
Source: Public Records
Map
Nearby Homes
- 1137 N Sherman St Unit 17
- 215 E 11th Ave Unit A5
- 215 E 11th Ave Unit A11
- 1196 N Grant St Unit 705
- 1196 N Grant St Unit 406
- 1196 N Grant St Unit 709
- 1196 N Grant St Unit 407
- 1196 N Grant St Unit 501
- 1136 N Logan St Unit 8
- 1220 Logan St Unit 1224
- 55 W 12th Ave Unit 408
- 1200 Acoma St Unit 303
- 1200 Acoma St Unit 203
- 1165 N Pennsylvania St Unit 3B
- 1014 Acoma St
- 975 N Lincoln St Unit 14D
- 975 N Lincoln St Unit 5A
- 975 N Lincoln St Unit 4F
- 1130 N Pennsylvania St Unit 307
- 1130 N Pennsylvania St Unit 306
- 1137 N Sherman St Unit 9
- 1137 N Sherman St Unit 23
- 1137 N Sherman St Unit 1
- 1137 N Sherman St Unit 5
- 1137 N Sherman St Unit 16
- 1137 N Sherman St Unit 11
- 1137 Sherman St
- 1137 Sherman St Unit 22
- 1137 Sherman St Unit 21
- 1137 Sherman St Unit 20
- 1137 Sherman St Unit 19
- 1137 Sherman St Unit 18
- 1137 Sherman St Unit 17
- 1137 Sherman St Unit 16
- 1137 Sherman St Unit 15
- 1137 Sherman St Unit 14
- 1137 Sherman St Unit 12
- 1137 Sherman St Unit 11
- 1137 Sherman St Unit 9
- 1137 Sherman St Unit 8