11370 Jay St NW Coon Rapids, MN 55433
Estimated Value: $221,000 - $249,000
3
Beds
2
Baths
1,381
Sq Ft
$168/Sq Ft
Est. Value
About This Home
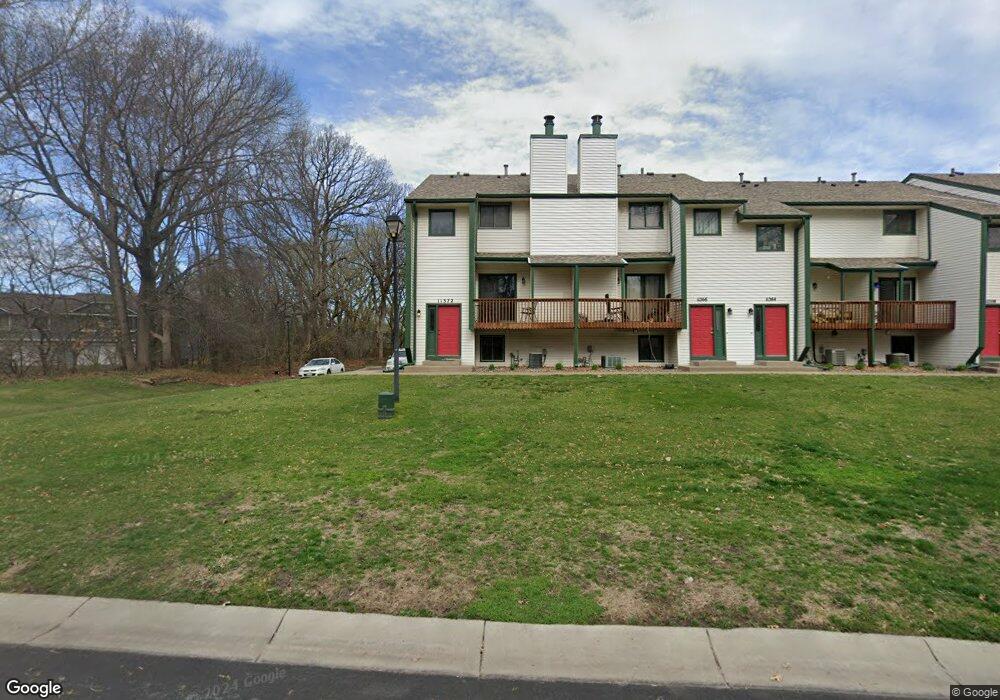
This home is located at 11370 Jay St NW, Coon Rapids, MN 55433 and is currently estimated at $231,584, approximately $167 per square foot. 11370 Jay St NW is a home located in Anoka County with nearby schools including Lucile Bruner Elementary School, Hamilton Elementary School, and Laughlin Junior/Senior High School.
Ownership History
Date
Name
Owned For
Owner Type
Purchase Details
Closed on
Sep 2, 2020
Sold by
Bergeron Kristi
Bought by
Bergeron Logan
Current Estimated Value
Purchase Details
Closed on
Dec 9, 2011
Sold by
Jjm Homes Llc
Bought by
Bergeron Kristi
Purchase Details
Closed on
Apr 25, 2003
Sold by
Holt Lee and Campbell Kassia
Bought by
Brown Curtis and Canion Jeffrey
Purchase Details
Closed on
May 18, 2000
Sold by
Boyer Patrick S
Bought by
Holt Lee G and Campbell Kassia R
Purchase Details
Closed on
Apr 30, 1996
Sold by
Star Jeffrey J
Bought by
Boyer Samuel H and Boyer Patrick S
Purchase Details
Closed on
Mar 6, 1996
Sold by
Peahl Robert H
Bought by
Star Jeffrey J and Star Denise J
Create a Home Valuation Report for This Property
The Home Valuation Report is an in-depth analysis detailing your home's value as well as a comparison with similar homes in the area
Home Values in the Area
Average Home Value in this Area
Purchase History
| Date | Buyer | Sale Price | Title Company |
|---|---|---|---|
| Bergeron Logan | -- | Title Mark Llc | |
| Bergeron Kristi | $96,500 | -- | |
| Brown Curtis | $142,400 | -- | |
| Holt Lee G | $101,300 | -- | |
| Boyer Samuel H | $59,600 | -- | |
| Star Jeffrey J | $62,000 | -- |
Source: Public Records
Mortgage History
| Date | Status | Borrower | Loan Amount |
|---|---|---|---|
| Closed | Star Jeffrey J | -- |
Source: Public Records
Tax History Compared to Growth
Tax History
| Year | Tax Paid | Tax Assessment Tax Assessment Total Assessment is a certain percentage of the fair market value that is determined by local assessors to be the total taxable value of land and additions on the property. | Land | Improvement |
|---|---|---|---|---|
| 2025 | $2,093 | $221,700 | $40,000 | $181,700 |
| 2024 | $2,012 | $207,100 | $39,000 | $168,100 |
| 2023 | $3,009 | $212,500 | $39,000 | $173,500 |
| 2022 | $1,866 | $215,000 | $40,500 | $174,500 |
| 2021 | $1,730 | $179,700 | $41,000 | $138,700 |
| 2020 | $1,850 | $166,300 | $35,000 | $131,300 |
| 2019 | $1,736 | $169,600 | $30,000 | $139,600 |
| 2018 | $1,385 | $146,800 | $0 | $0 |
| 2017 | $1,393 | $126,600 | $0 | $0 |
| 2016 | $1,292 | $116,500 | $0 | $0 |
| 2015 | $1,292 | $116,500 | $21,600 | $94,900 |
| 2014 | -- | $84,900 | $9,800 | $75,100 |
Source: Public Records
Map
Nearby Homes
- 11350 Jay St NW
- 11361 Jay St NW
- 11424 Hanson Blvd NW
- 11444 Hanson Blvd NW
- 11409 Quinn St NW
- 1660 Northdale Blvd NW
- 11267 Robinson Dr NW
- 11036 Hanson Blvd NW Unit 20
- 11000 Swallow St NW
- 1449 119th Ln NW
- 12034 Ibis St NW
- 12010 Eagle St NW
- 2201 108th Ave NW
- 2400 108th Ave NW
- 1830 121st Ln NW Unit 611
- 10658 Hummingbird St NW
- 11852 Yellow Pine St NW
- 1727 121st Ln NW
- 10634 Hummingbird St NW
- 11923 Wintergreen St NW
- 11368 Jay St NW
- 11362 Jay St NW
- 11360 Jay St NW
- 11354 Jay St NW
- 11352 Jay St NW
- 11366 Jay St NW
- 11364 Jay St NW
- 11358 Jay St NW
- 1855 113th Ln NW
- 11356 Jay St NW
- 1863 113th Ln NW
- 11420 Jay St NW
- 1851 113th Ln NW
- 11422 Jay St NW
- 1859 113th Ln NW
- 11424 Jay St NW
- 1871 113th Ln NW
- 11426 Jay St NW
- 1876 114th Ave NW
- 11428 Jay St NW