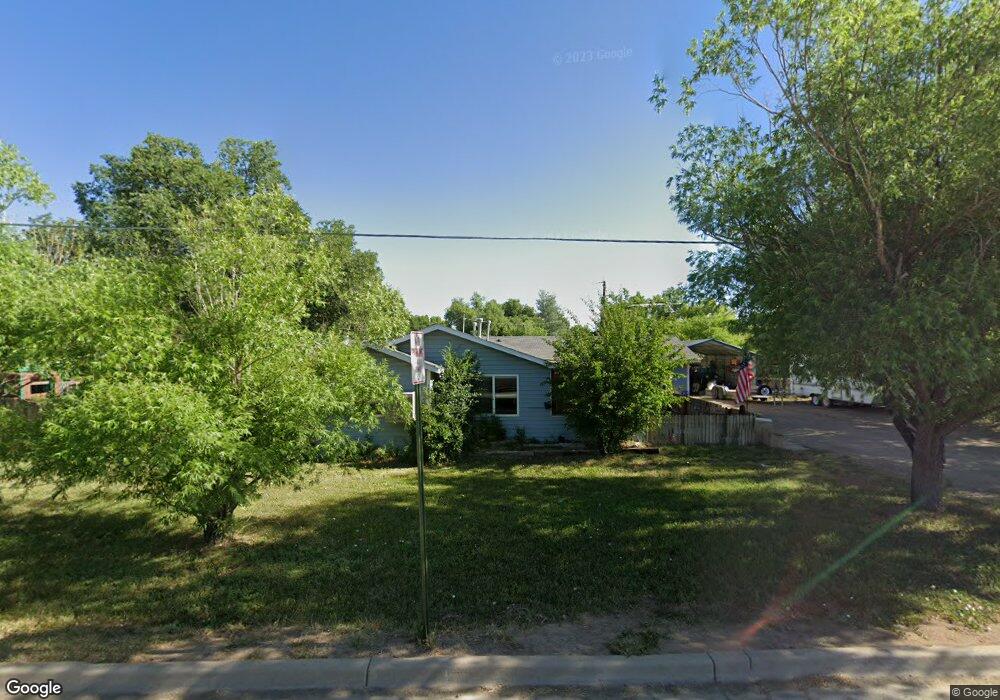
1138 E Empire St Cortez, CO 81321
Estimated Value: $268,561 - $336,000
3
Beds
2
Baths
1,470
Sq Ft
$212/Sq Ft
Est. Value
About This Home
This home is located at 1138 E Empire St, Cortez, CO 81321 and is currently estimated at $311,890, approximately $212 per square foot. 1138 E Empire St is a home located in Montezuma County with nearby schools including Montezuma-Cortez High School, Children's Kiva Montessori School, and Southwest Open Charter School.
Ownership History
Date
Name
Owned For
Owner Type
Purchase Details
Closed on
Nov 24, 2014
Sold by
Rosas Herman
Bought by
Gilliam Rodney
Current Estimated Value
Home Financials for this Owner
Home Financials are based on the most recent Mortgage that was taken out on this home.
Original Mortgage
$133,156
Outstanding Balance
$102,526
Interest Rate
4.14%
Mortgage Type
New Conventional
Estimated Equity
$209,364
Purchase Details
Closed on
Jun 27, 2005
Sold by
The Real Estate Realm Llc
Bought by
Rosas Herman
Home Financials for this Owner
Home Financials are based on the most recent Mortgage that was taken out on this home.
Original Mortgage
$102,545
Interest Rate
5.76%
Mortgage Type
Adjustable Rate Mortgage/ARM
Purchase Details
Closed on
Jun 15, 2004
Sold by
Maupin Roger B
Bought by
Real Estate Realm Llc The
Purchase Details
Closed on
Apr 12, 2004
Sold by
Miller Bill W
Bought by
Federal Home Loan Mortgage
Create a Home Valuation Report for This Property
The Home Valuation Report is an in-depth analysis detailing your home's value as well as a comparison with similar homes in the area
Purchase History
| Date | Buyer | Sale Price | Title Company |
|---|---|---|---|
| Gilliam Rodney | $131,000 | None Available | |
| Rosas Herman | $128,200 | None Available | |
| Real Estate Realm Llc The | -- | -- | |
| Maupin Roger B | $65,000 | -- | |
| Federal Home Loan Mortgage | -- | -- |
Source: Public Records
Mortgage History
| Date | Status | Borrower | Loan Amount |
|---|---|---|---|
| Open | Gilliam Rodney | $133,156 | |
| Previous Owner | Rosas Herman | $102,545 |
Source: Public Records
Tax History
| Year | Tax Paid | Tax Assessment Tax Assessment Total Assessment is a certain percentage of the fair market value that is determined by local assessors to be the total taxable value of land and additions on the property. | Land | Improvement |
|---|---|---|---|---|
| 2024 | $1,358 | $18,867 | $4,245 | $14,622 |
| 2023 | $970 | $23,245 | $5,230 | $18,015 |
| 2022 | $768 | $15,879 | $2,388 | $13,491 |
| 2021 | $781 | $15,879 | $2,388 | $13,491 |
| 2020 | $545 | $11,510 | $2,627 | $8,883 |
| 2019 | $546 | $11,510 | $2,627 | $8,883 |
| 2018 | $781 | $12,250 | $2,380 | $9,870 |
| 2017 | $777 | $12,250 | $2,380 | $9,870 |
| 2016 | $680 | $11,830 | $2,630 | $9,200 |
| 2015 | $624 | $172,180 | $0 | $0 |
| 2014 | $726 | $11,830 | $0 | $0 |
Source: Public Records
Map
Nearby Homes
- 1328 Jackson St
- 938 Livesay Dr
- TBD E Driscoll St
- TBD E Empire St
- 1615 Rivera St
- 506 Amanda Lee Ln
- TBD Aldridge Rd
- 1510 Mesa Verde St
- 532 E Arbecam Ave
- 1702 E Macarthur Ave
- 1118 E Main St
- TBD N Mildred Rd
- 112 N Adams St
- TBD Sligo St
- 613 Colorado St
- 1513 Macarthur Ave
- 137 and 141 N Madison
- 416 N Ash St
- 710 Wedgewood St
- 1010 E 2nd St
- 1084 E Empire St
- 1172 E Empire St
- 1103 E Carpenter St
- 1111 E Carpenter St
- 1058 E Empire St
- 1009 E Carpenter St
- 1005 E Carpenter St
- 1002 E Empire St
- 1102 E Carpenter St
- 708 N Mildred Rd
- 1106 E Carpenter St
- 1114 E Carpenter St
- 710 N Mildred Rd
- 801 Cornett St
- 804 Cornett St
- 1111 E Driscoll St
- 808 Cornett St
- 805 Cornett St
- 808 N Mildred Rd
- 807 Cornett St
Your Personal Tour Guide
Ask me questions while you tour the home.