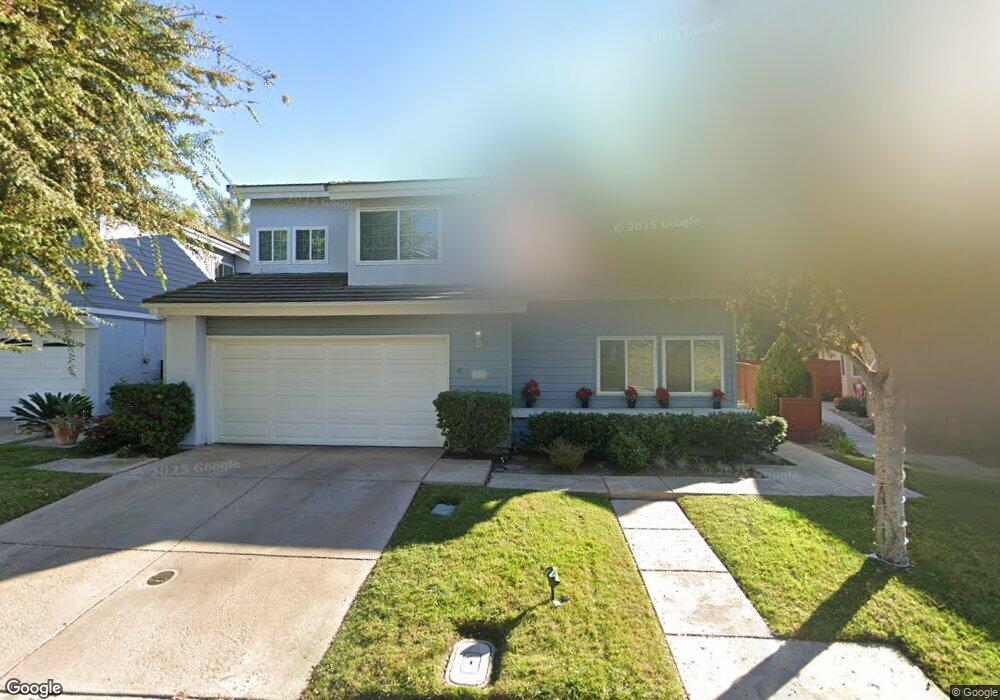
1138 Erin Dr El Cajon, CA 92020
Fletcher Hills NeighborhoodEstimated Value: $1,035,000 - $1,163,000
4
Beds
3
Baths
2,087
Sq Ft
$522/Sq Ft
Est. Value
About This Home
This home is located at 1138 Erin Dr, El Cajon, CA 92020 and is currently estimated at $1,088,671, approximately $521 per square foot. 1138 Erin Dr is a home located in San Diego County with nearby schools including Fletcher Hills Elementary School, Parkway Academy, and West Hills High School.
Ownership History
Date
Name
Owned For
Owner Type
Purchase Details
Closed on
Jun 15, 2010
Sold by
Sandoval Ray E and Sandoval Brenda
Bought by
Sandoval Ray E and Sandoval Brenda
Current Estimated Value
Home Financials for this Owner
Home Financials are based on the most recent Mortgage that was taken out on this home.
Original Mortgage
$267,400
Outstanding Balance
$178,684
Interest Rate
4.91%
Mortgage Type
New Conventional
Estimated Equity
$909,987
Purchase Details
Closed on
May 11, 2004
Sold by
Foley Edmund O and Foley Mary J
Bought by
Sandoval Ray and Sandoval Brenda
Home Financials for this Owner
Home Financials are based on the most recent Mortgage that was taken out on this home.
Original Mortgage
$278,500
Interest Rate
1.25%
Mortgage Type
Purchase Money Mortgage
Purchase Details
Closed on
Apr 23, 1990
Purchase Details
Closed on
Dec 31, 1987
Create a Home Valuation Report for This Property
The Home Valuation Report is an in-depth analysis detailing your home's value as well as a comparison with similar homes in the area
Home Values in the Area
Average Home Value in this Area
Purchase History
| Date | Buyer | Sale Price | Title Company |
|---|---|---|---|
| Sandoval Ray E | -- | Ticor Title Company | |
| Sandoval Ray | $622,500 | Fidelity National Title | |
| -- | $262,500 | -- | |
| -- | $186,000 | -- |
Source: Public Records
Mortgage History
| Date | Status | Borrower | Loan Amount |
|---|---|---|---|
| Open | Sandoval Ray E | $267,400 | |
| Previous Owner | Sandoval Ray | $278,500 | |
| Closed | Sandoval Ray | $145,000 |
Source: Public Records
Tax History Compared to Growth
Tax History
| Year | Tax Paid | Tax Assessment Tax Assessment Total Assessment is a certain percentage of the fair market value that is determined by local assessors to be the total taxable value of land and additions on the property. | Land | Improvement |
|---|---|---|---|---|
| 2025 | $10,676 | $867,633 | $348,447 | $519,186 |
| 2024 | $10,676 | $850,621 | $341,615 | $509,006 |
| 2023 | $9,861 | $785,000 | $314,000 | $471,000 |
| 2022 | $9,603 | $750,000 | $300,000 | $450,000 |
| 2021 | $8,804 | $675,000 | $270,000 | $405,000 |
| 2020 | $8,109 | $650,000 | $260,000 | $390,000 |
| 2019 | $6,905 | $600,000 | $240,000 | $360,000 |
| 2018 | $6,897 | $600,000 | $240,000 | $360,000 |
| 2017 | $6,759 | $585,000 | $234,000 | $351,000 |
| 2016 | $6,554 | $575,000 | $230,000 | $345,000 |
| 2015 | $6,088 | $530,000 | $212,000 | $318,000 |
| 2014 | $5,737 | $500,000 | $200,000 | $300,000 |
Source: Public Records
Map
Nearby Homes
- 2524 Seattle Dr
- 2548 Katherine Ct
- 700 Wakefield Ct
- 2052 Flying Hills Ln
- 1958 Milford Place
- 0 Hacienda Dr
- 2527 Gibbons St
- 2106 Windmill View Rd
- 8774 Tommy Dr
- 2213 Chatham St
- 1677 Heron Ave
- 9254 Lake Murray Blvd Unit B
- 363 Garden Grove Ln
- 8735 Navajo Rd Unit 8
- 8767 Navajo Rd Unit 12
- 282 Garfield Ave
- 6802 Maury Dr
- 8717 Navajo Rd Unit 1
- 8721 Lake Murray Blvd Unit 1
- 8765 Lake Murray Blvd Unit 11