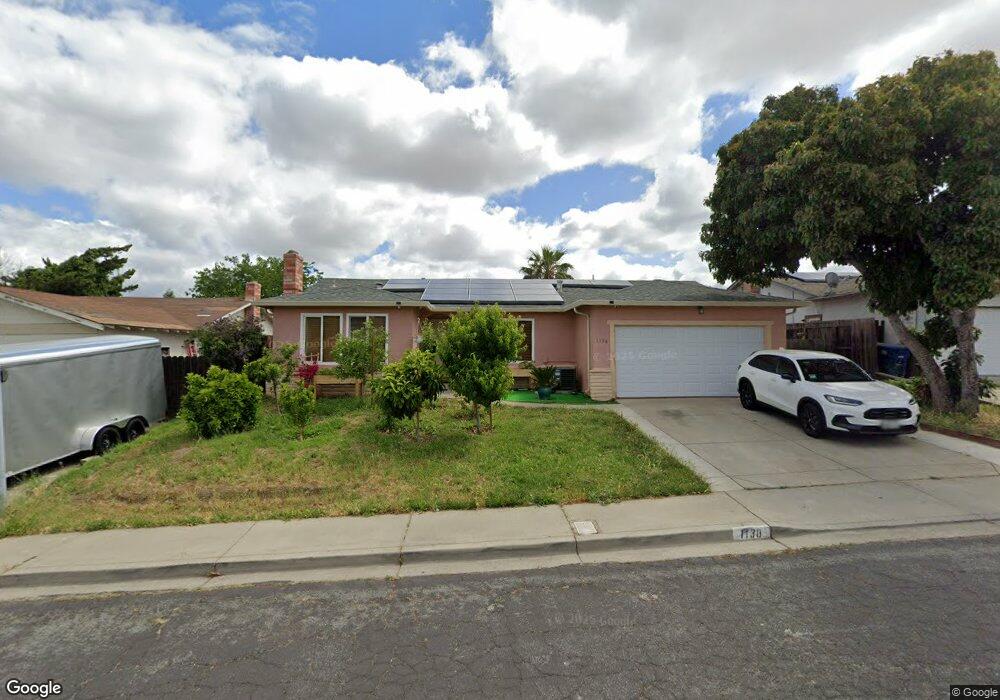
1138 Jensen Cir Pittsburg, CA 94565
East Contra Costa NeighborhoodEstimated Value: $565,717 - $602,000
3
Beds
2
Baths
1,223
Sq Ft
$473/Sq Ft
Est. Value
About This Home
This home is located at 1138 Jensen Cir, Pittsburg, CA 94565 and is currently estimated at $578,179, approximately $472 per square foot. 1138 Jensen Cir is a home located in Contra Costa County with nearby schools including Foothill Elementary School, Hillview Junior High School, and Pittsburg Senior High School.
Ownership History
Date
Name
Owned For
Owner Type
Purchase Details
Closed on
Aug 27, 2015
Sold by
Holman Longrel and Jackson Longrel
Bought by
Carreno Hipolito and Carreno Elda Adrianana
Current Estimated Value
Home Financials for this Owner
Home Financials are based on the most recent Mortgage that was taken out on this home.
Original Mortgage
$317,149
Outstanding Balance
$249,609
Interest Rate
3.97%
Mortgage Type
FHA
Estimated Equity
$328,570
Purchase Details
Closed on
Jan 17, 2009
Sold by
Federal Home Loan Mortgage Corporation
Bought by
Jackson Longrel
Home Financials for this Owner
Home Financials are based on the most recent Mortgage that was taken out on this home.
Original Mortgage
$152,093
Interest Rate
4.71%
Mortgage Type
FHA
Purchase Details
Closed on
Jul 15, 2008
Sold by
Bellani Frank M
Bought by
Federal Home Loan Mortgage Corporation
Purchase Details
Closed on
Mar 31, 2000
Sold by
Vinson Grace H Tre
Bought by
Bellani Frank M
Home Financials for this Owner
Home Financials are based on the most recent Mortgage that was taken out on this home.
Original Mortgage
$153,970
Interest Rate
8.3%
Mortgage Type
FHA
Create a Home Valuation Report for This Property
The Home Valuation Report is an in-depth analysis detailing your home's value as well as a comparison with similar homes in the area
Home Values in the Area
Average Home Value in this Area
Purchase History
| Date | Buyer | Sale Price | Title Company |
|---|---|---|---|
| Carreno Hipolito | $323,000 | First American Title Company | |
| Jackson Longrel | $155,000 | Ticor Title Redlands | |
| Federal Home Loan Mortgage Corporation | $230,000 | Accommodation | |
| Bellani Frank M | $155,000 | American Title Co |
Source: Public Records
Mortgage History
| Date | Status | Borrower | Loan Amount |
|---|---|---|---|
| Open | Carreno Hipolito | $317,149 | |
| Previous Owner | Jackson Longrel | $152,093 | |
| Previous Owner | Bellani Frank M | $153,970 |
Source: Public Records
Tax History Compared to Growth
Tax History
| Year | Tax Paid | Tax Assessment Tax Assessment Total Assessment is a certain percentage of the fair market value that is determined by local assessors to be the total taxable value of land and additions on the property. | Land | Improvement |
|---|---|---|---|---|
| 2025 | $4,818 | $382,358 | $136,132 | $246,226 |
| 2024 | $4,850 | $374,862 | $133,463 | $241,399 |
| 2023 | $4,850 | $367,513 | $130,847 | $236,666 |
| 2022 | $4,921 | $360,308 | $128,282 | $232,026 |
| 2021 | $4,925 | $353,244 | $125,767 | $227,477 |
| 2019 | $4,698 | $342,769 | $122,038 | $220,731 |
| 2018 | $4,522 | $336,049 | $119,646 | $216,403 |
| 2017 | $4,496 | $329,460 | $117,300 | $212,160 |
| 2016 | $4,212 | $323,000 | $115,000 | $208,000 |
| 2015 | $2,475 | $166,075 | $58,929 | $107,146 |
| 2014 | $2,393 | $162,823 | $57,775 | $105,048 |
Source: Public Records
Map
Nearby Homes
- 4318 Palo Verde Dr
- 17 Cedarbrook Place
- 1513 Kingsly Dr
- 4307 Suzanne Dr
- 1248 Metten Ave
- 4257 Suzanne Dr
- 4175 Stephanie Way
- 4309 Oakdale Place
- 1449 Ventura Dr
- 300 San Simeon Place
- 3036 Peppermill Cir
- 128 Peppermill Ln
- 4257 Heights Ave
- 471 Rich Spring Dr
- 1971 Canyon Oaks Cir
- 1593 Norine Dr
- 14 Meadowbrook Ave
- 9 Palm Dr
- 46 Palm Dr
- 4068 Barn Hollow Way
- 1120 Jensen Cir
- 1146 Jensen Cir
- 4314 San Miguel Cir
- 4310 San Miguel Cir
- 1108 Jensen Cir
- 4318 San Miguel Cir
- 4306 San Miguel Cir
- 1141 Jensen Cir
- 1133 Jensen Cir
- 1157 Jensen Cir
- 1105 Jensen Cir
- 4322 San Miguel Cir
- 1102 Jensen Cir
- 1180 Jensen Cir
- 4302 San Miguel Cir
- 1173 Jensen Cir
- 4326 San Miguel Cir
- 1085 Jensen Cir
- 4319 San Miguel Cir
- 971 Jensen Cir