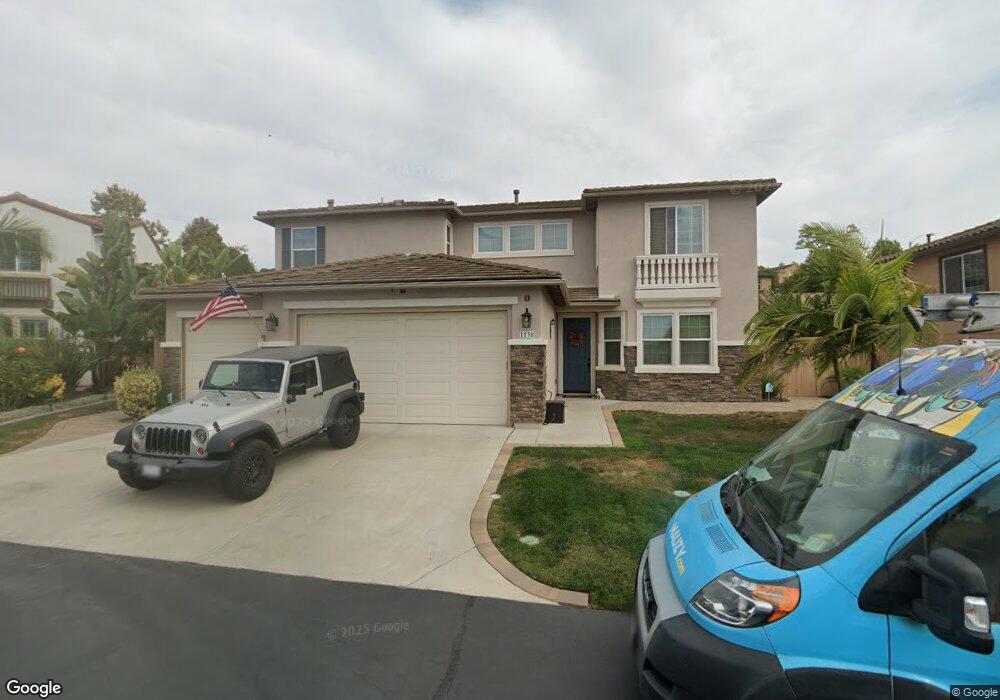
1138 Sagewood Dr Oceanside, CA 92056
Guajome NeighborhoodEstimated Value: $1,135,386 - $1,266,000
3
Beds
3
Baths
2,924
Sq Ft
$413/Sq Ft
Est. Value
About This Home
This home is located at 1138 Sagewood Dr, Oceanside, CA 92056 and is currently estimated at $1,208,597, approximately $413 per square foot. 1138 Sagewood Dr is a home located in San Diego County with nearby schools including Alamosa Park Elementary School, Roosevelt Middle School, and Vista High School.
Ownership History
Date
Name
Owned For
Owner Type
Purchase Details
Closed on
Jun 25, 2020
Sold by
Clevenger Darcy E M
Bought by
Clevenger Andrew H
Current Estimated Value
Home Financials for this Owner
Home Financials are based on the most recent Mortgage that was taken out on this home.
Original Mortgage
$510,000
Outstanding Balance
$451,387
Interest Rate
3%
Mortgage Type
VA
Estimated Equity
$757,210
Purchase Details
Closed on
Jul 24, 2012
Sold by
Zephyr Panorama Ridge Llc
Bought by
Clevenger Andrew H and Clevenver Darcy E M
Home Financials for this Owner
Home Financials are based on the most recent Mortgage that was taken out on this home.
Original Mortgage
$488,992
Interest Rate
3.65%
Mortgage Type
VA
Purchase Details
Closed on
Jun 22, 2011
Sold by
Panorama Ridge Llc
Bought by
Zephyr Panorama Ridge Llc
Home Financials for this Owner
Home Financials are based on the most recent Mortgage that was taken out on this home.
Original Mortgage
$1,700,000
Interest Rate
4.56%
Mortgage Type
Purchase Money Mortgage
Create a Home Valuation Report for This Property
The Home Valuation Report is an in-depth analysis detailing your home's value as well as a comparison with similar homes in the area
Home Values in the Area
Average Home Value in this Area
Purchase History
| Date | Buyer | Sale Price | Title Company |
|---|---|---|---|
| Clevenger Andrew H | -- | Servicelink | |
| Clevenger Andrew H | $493,000 | First American Title Company | |
| Zephyr Panorama Ridge Llc | $2,727,332 | First American Title |
Source: Public Records
Mortgage History
| Date | Status | Borrower | Loan Amount |
|---|---|---|---|
| Open | Clevenger Andrew H | $510,000 | |
| Closed | Clevenger Andrew H | $488,992 | |
| Previous Owner | Zephyr Panorama Ridge Llc | $1,700,000 |
Source: Public Records
Tax History
| Year | Tax Paid | Tax Assessment Tax Assessment Total Assessment is a certain percentage of the fair market value that is determined by local assessors to be the total taxable value of land and additions on the property. | Land | Improvement |
|---|---|---|---|---|
| 2025 | $6,440 | $607,071 | $184,707 | $422,364 |
| 2024 | $6,440 | $595,169 | $181,086 | $414,083 |
| 2023 | $6,284 | $583,500 | $177,536 | $405,964 |
| 2022 | $6,267 | $572,059 | $174,055 | $398,004 |
| 2021 | $6,126 | $560,843 | $170,643 | $390,200 |
| 2020 | $6,104 | $555,093 | $168,894 | $386,199 |
| 2019 | $6,013 | $544,210 | $165,583 | $378,627 |
| 2018 | $5,714 | $533,540 | $162,337 | $371,203 |
| 2017 | $5,607 | $523,079 | $159,154 | $363,925 |
| 2016 | $5,473 | $512,824 | $156,034 | $356,790 |
| 2015 | $5,451 | $505,122 | $153,691 | $351,431 |
| 2014 | $5,314 | $495,228 | $150,681 | $344,547 |
Source: Public Records
Map
Nearby Homes
- 1162 Sagewood Dr
- 1288 Sagewood Dr
- 1247 Sunglow Dr
- 5216 Palmera Dr
- 475 Taylor Dr
- 5013 Sunrose Ct
- 1513 Powell Rd
- 1704 Laurelwood Way
- 1351 Cottonwood Dr
- 5177 Loma Verde
- 1376 Darwin Dr
- 1413 Eastview Ct
- 5103 Mandarin Dr
- 1433 Grey Oaks Ct
- 1852 Red Willow Way
- 1508 Laurelwood Way
- 4699 Mystik Rd
- 1517 Leonis Place
- 1413 Panorama Ridge Rd
- 1728 Valley Oak Way
- 1134 Sagewood Dr
- 1142 Sagewood Dr
- 1158 Sagewood Dr
- 5226 Rancho Ct
- 1120 Sagewood Dr
- 5223 Rancho Ct
- 1116 Sagewood Dr
- 1124 Sagewood Dr
- 1128 Sagewood Dr
- 5230 Rancho Ct
- 1121 Sagewood Dr
- 5225 White Oak Ct
- 5227 Rancho Ct
- 1117 Sagewood Dr
- 1166 Sagewood Dr
- 1113 Sagewood Dr
- 5234 Rancho Ct
- 5229 White Oak Ct
- 5224 Jack Pine Ct
- 1109 Sagewood Dr
Your Personal Tour Guide
Ask me questions while you tour the home.