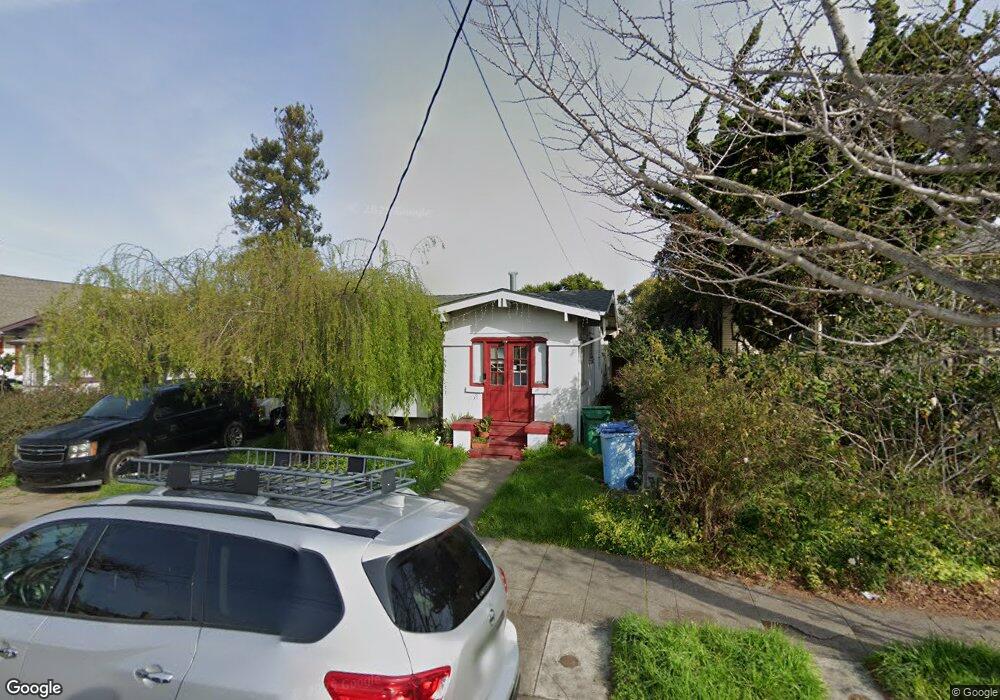
1139 Allston Way Berkeley, CA 94702
West Berkeley NeighborhoodEstimated Value: $1,007,822 - $1,324,000
3
Beds
1
Bath
1,145
Sq Ft
$1,041/Sq Ft
Est. Value
About This Home
This home is located at 1139 Allston Way, Berkeley, CA 94702 and is currently estimated at $1,191,456, approximately $1,040 per square foot. 1139 Allston Way is a home located in Alameda County with nearby schools including Rosa Parks Elementary School, Ruth Acty Elementary, and Berkeley Arts Magnet at Whittier School.
Ownership History
Date
Name
Owned For
Owner Type
Purchase Details
Closed on
Jun 7, 2023
Sold by
Brown Etta R
Bought by
Etta R Brown Living Trust and Brown
Current Estimated Value
Purchase Details
Closed on
Aug 10, 2021
Sold by
Brown Etta R and Bobino Twila A
Bought by
Brown Etta R
Purchase Details
Closed on
Jan 27, 2018
Sold by
Brown Willie L and Brown Etta R
Bought by
Brown Etta R and Bobino Twila A
Purchase Details
Closed on
Sep 3, 2011
Sold by
Brown Willie L and Brown Etta R
Bought by
Brown Willie L and Brown Etta R
Purchase Details
Closed on
Jun 9, 2010
Sold by
Brown Willie Lee and Brown Reva M
Bought by
Brown Willie Lee and Brown Etta R
Purchase Details
Closed on
Feb 13, 2010
Sold by
Brown Willie Lee and Brown Reva M
Bought by
Brown Willie Lee and Brown Reva M
Purchase Details
Closed on
Oct 22, 2007
Sold by
Brown Willie Lee and Brown Reva M
Bought by
Brown Willie Lee and Brown Reva M
Create a Home Valuation Report for This Property
The Home Valuation Report is an in-depth analysis detailing your home's value as well as a comparison with similar homes in the area
Home Values in the Area
Average Home Value in this Area
Purchase History
| Date | Buyer | Sale Price | Title Company |
|---|---|---|---|
| Etta R Brown Living Trust | -- | None Listed On Document | |
| Brown Etta R | -- | None Available | |
| Brown Etta R | -- | None Available | |
| Brown Willie L | -- | None Available | |
| Brown Willie Lee | -- | None Available | |
| Brown Willie Lee | -- | None Available | |
| Brown Willie Lee | -- | None Available |
Source: Public Records
Tax History
| Year | Tax Paid | Tax Assessment Tax Assessment Total Assessment is a certain percentage of the fair market value that is determined by local assessors to be the total taxable value of land and additions on the property. | Land | Improvement |
|---|---|---|---|---|
| 2025 | $3,672 | $44,487 | $27,950 | $23,537 |
| 2024 | $3,672 | $43,477 | $27,402 | $23,075 |
| 2023 | $3,511 | $49,488 | $26,865 | $22,623 |
| 2022 | $3,331 | $41,517 | $26,338 | $22,179 |
| 2021 | $3,297 | $40,566 | $25,822 | $21,744 |
| 2020 | $3,033 | $47,078 | $25,557 | $21,521 |
| 2019 | $2,789 | $46,156 | $25,056 | $21,100 |
| 2018 | $2,697 | $45,251 | $24,565 | $20,686 |
| 2017 | $2,566 | $44,363 | $24,083 | $20,280 |
| 2016 | $2,384 | $43,494 | $23,611 | $19,883 |
| 2015 | $2,330 | $42,840 | $23,256 | $19,584 |
| 2014 | $2,266 | $42,001 | $22,801 | $19,200 |
Source: Public Records
Map
Nearby Homes
- 1230 Addison St
- 2231 Byron St
- 2324 Browning St
- 1919 Curtis St
- 2241 Ninth St
- 2327 10th St Unit 4
- 2013 9th St
- 1261 Hearst Ave
- 1039 Channing Way
- 931 Bancroft Way
- 1128 Delaware St
- 1050 Allston Way
- 1144 Dwight Way
- 1142 Dwight Way
- 1118 Dwight Way
- 1728 Curtis St
- 2220 7th St
- 2350 Sacramento St
- 2238 7th St
- 917 Channing Way
- 1141 Allston Way
- 1137 Allston Way
- 2148 Curtis St
- 1133 Allston Way
- 2140 Curtis St
- 2139 Byron St
- 2134 Curtis St
- 2149 Byron St
- 1142 Allston Way
- 2132 Curtis St
- 1138 Allston Way
- 2133 Byron St
- 1134 Allston Way
- 1130 Allston Way
- 2149 Curtis St
- 1128 Allston Way
- 2131 Byron St
- 2128 Curtis St
- 2206 Curtis St
- 2129 Byron St
Your Personal Tour Guide
Ask me questions while you tour the home.