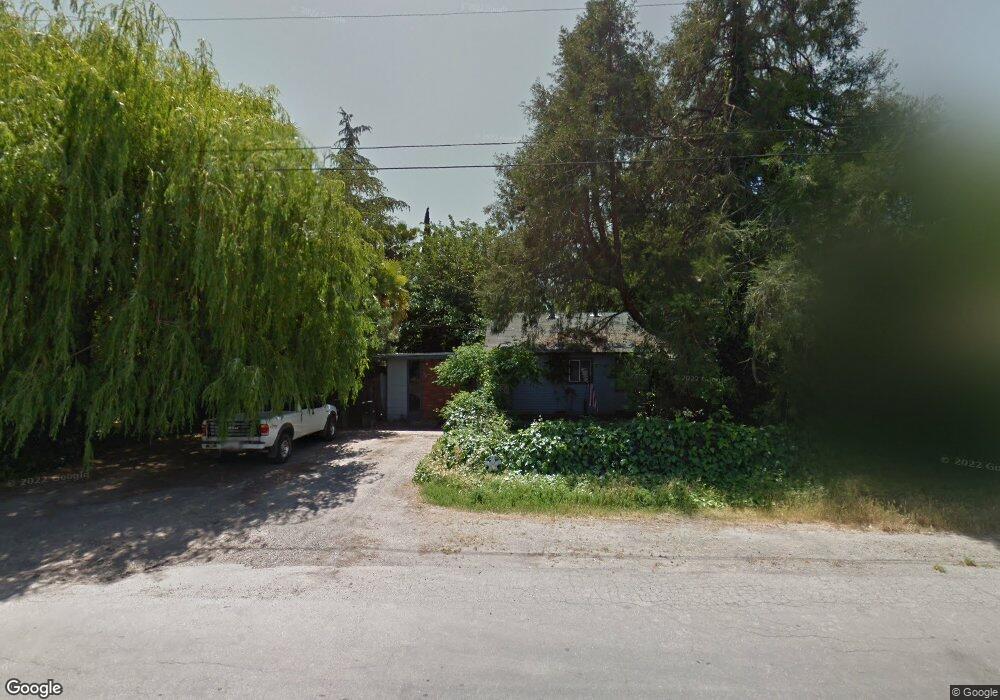
1139 Locust St Gridley, CA 95948
Estimated Value: $179,000 - $358,000
2
Beds
1
Bath
1,140
Sq Ft
$235/Sq Ft
Est. Value
About This Home
This home is located at 1139 Locust St, Gridley, CA 95948 and is currently estimated at $268,430, approximately $235 per square foot. 1139 Locust St is a home located in Butte County with nearby schools including McKinley Elementary School, Wilson Elementary School, and Sycamore Middle School.
Ownership History
Date
Name
Owned For
Owner Type
Purchase Details
Closed on
Dec 29, 2000
Sold by
Jacquot Robert E
Bought by
Jacquot Robert E and Jacquot Deirdre L
Current Estimated Value
Purchase Details
Closed on
Feb 13, 1997
Sold by
Pendergrass James C and Pendergrass Patsy D
Bought by
Jacquot Robert E
Home Financials for this Owner
Home Financials are based on the most recent Mortgage that was taken out on this home.
Original Mortgage
$80,478
Interest Rate
7.86%
Mortgage Type
VA
Create a Home Valuation Report for This Property
The Home Valuation Report is an in-depth analysis detailing your home's value as well as a comparison with similar homes in the area
Home Values in the Area
Average Home Value in this Area
Purchase History
| Date | Buyer | Sale Price | Title Company |
|---|---|---|---|
| Jacquot Robert E | -- | -- | |
| Jacquot Robert E | $79,000 | Bidwell Title & Escrow Compa |
Source: Public Records
Mortgage History
| Date | Status | Borrower | Loan Amount |
|---|---|---|---|
| Previous Owner | Jacquot Robert E | $80,478 |
Source: Public Records
Tax History
| Year | Tax Paid | Tax Assessment Tax Assessment Total Assessment is a certain percentage of the fair market value that is determined by local assessors to be the total taxable value of land and additions on the property. | Land | Improvement |
|---|---|---|---|---|
| 2025 | $1,856 | $174,815 | $56,984 | $117,831 |
| 2024 | $1,856 | $171,388 | $55,867 | $115,521 |
| 2023 | $1,845 | $168,028 | $54,772 | $113,256 |
| 2022 | $1,727 | $164,735 | $53,699 | $111,036 |
| 2021 | $1,685 | $161,506 | $52,647 | $108,859 |
| 2020 | $1,681 | $159,851 | $52,108 | $107,743 |
| 2019 | $1,632 | $156,718 | $51,087 | $105,631 |
| 2018 | $1,621 | $153,646 | $50,086 | $103,560 |
| 2017 | $1,588 | $150,634 | $49,104 | $101,530 |
| 2016 | $1,524 | $147,682 | $48,142 | $99,540 |
| 2015 | $1,568 | $145,464 | $47,419 | $98,045 |
| 2014 | $1,543 | $142,616 | $46,491 | $96,125 |
Source: Public Records
Map
Nearby Homes
Your Personal Tour Guide
Ask me questions while you tour the home.