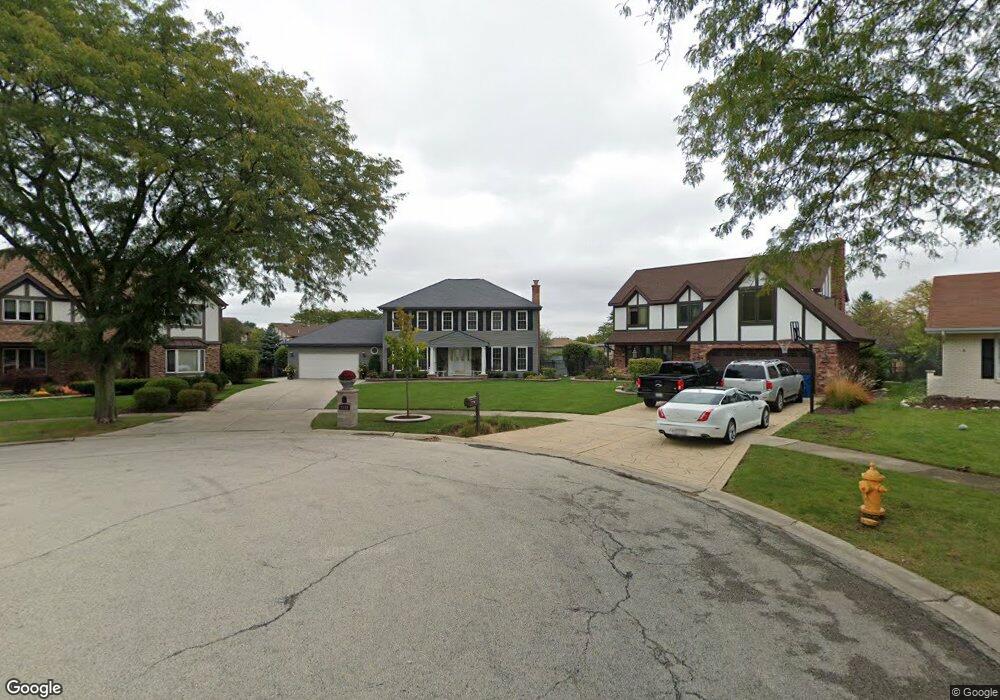
1139 N Thatcher Ln Addison, IL 60101
Estimated Value: $507,742 - $628,000
4
Beds
5
Baths
2,194
Sq Ft
$251/Sq Ft
Est. Value
About This Home
This home is located at 1139 N Thatcher Ln, Addison, IL 60101 and is currently estimated at $550,686, approximately $250 per square foot. 1139 N Thatcher Ln is a home located in DuPage County with nearby schools including Stone Elementary School, Indian Trail Jr High School, and Addison Trail High School.
Ownership History
Date
Name
Owned For
Owner Type
Purchase Details
Closed on
Oct 23, 2024
Sold by
Anthony M Liace 2011 Trust and Liace Anthony M
Bought by
Laura M Liace 2011 Trust and Liace
Current Estimated Value
Purchase Details
Closed on
Apr 4, 2011
Sold by
Liace Anthony M and Liace Laura M
Bought by
Liace Anthony M and Liace Laura M
Purchase Details
Closed on
Jun 4, 2004
Sold by
Lucente Joseph C and Lucente Sharon C
Bought by
Liace Anthony M and Liace Laura M
Home Financials for this Owner
Home Financials are based on the most recent Mortgage that was taken out on this home.
Original Mortgage
$140,000
Interest Rate
6.06%
Mortgage Type
Purchase Money Mortgage
Create a Home Valuation Report for This Property
The Home Valuation Report is an in-depth analysis detailing your home's value as well as a comparison with similar homes in the area
Home Values in the Area
Average Home Value in this Area
Purchase History
| Date | Buyer | Sale Price | Title Company |
|---|---|---|---|
| Laura M Liace 2011 Trust | -- | None Listed On Document | |
| Liace Anthony M | -- | None Available | |
| Liace Anthony M | $410,000 | First American Title |
Source: Public Records
Mortgage History
| Date | Status | Borrower | Loan Amount |
|---|---|---|---|
| Previous Owner | Liace Anthony M | $140,000 |
Source: Public Records
Tax History Compared to Growth
Tax History
| Year | Tax Paid | Tax Assessment Tax Assessment Total Assessment is a certain percentage of the fair market value that is determined by local assessors to be the total taxable value of land and additions on the property. | Land | Improvement |
|---|---|---|---|---|
| 2024 | $10,666 | $159,331 | $51,758 | $107,573 |
| 2023 | $10,193 | $146,470 | $47,580 | $98,890 |
| 2022 | $9,940 | $140,960 | $45,530 | $95,430 |
| 2021 | $9,529 | $135,020 | $43,610 | $91,410 |
| 2020 | $9,276 | $129,330 | $41,770 | $87,560 |
| 2019 | $9,216 | $124,350 | $40,160 | $84,190 |
| 2018 | $8,933 | $118,790 | $38,990 | $79,800 |
| 2017 | $8,707 | $113,530 | $37,260 | $76,270 |
| 2016 | $8,483 | $104,820 | $34,400 | $70,420 |
| 2015 | $8,281 | $96,830 | $31,780 | $65,050 |
| 2014 | $7,633 | $87,130 | $29,140 | $57,990 |
| 2013 | $7,476 | $88,900 | $29,730 | $59,170 |
Source: Public Records
Map
Nearby Homes
- 1202 W Surrey Rd
- 1065 N Jamey Ln
- 1275 W Lake St Unit 104
- 1210 N Foxdale Dr Unit 109
- 4N327 7th Ave
- 1660 W Prescott Place
- 1520 W Grove St
- 19W720 Woodland Ave
- 551 N 6th Ave
- 580 N Highlander Way
- 5N210 Central Rd
- 1155 W Westwood Trail
- 1527 W Holtz Ave
- 661 N Briar Hill Ln Unit 5
- 943 N Rohlwing Rd Unit 101H
- 953 N Rohlwing Rd Unit GB
- 465 W Dominion Dr Unit 1302
- 465 W Dominion Dr Unit 1001
- 581 Victoria Ln
- 818 N Rumple Ln
- 1137 N Thatcher Ln
- 1147 N Thatcher Ln
- 1205 W Sable Dr
- 1209 W Sable Dr
- 1135 N Thatcher Ln
- 1144 N 8th Ave
- 1201 W Sable Dr
- 1211 W Sable Dr
- 1148 N 8th Ave
- 1136 N 8th Ave
- 1133 N Thatcher Ln
- 1132 N 8th Ave
- 1129 N Thatcher Ln
- 1138 N Thatcher Ln
- 1128 N 8th Ave
- 1144 N Thatcher Ln
- 1136 N Thatcher Ln
- 1204 W Sable Dr
- 1134 N Thatcher Ln
- 1130 N Thatcher Ln