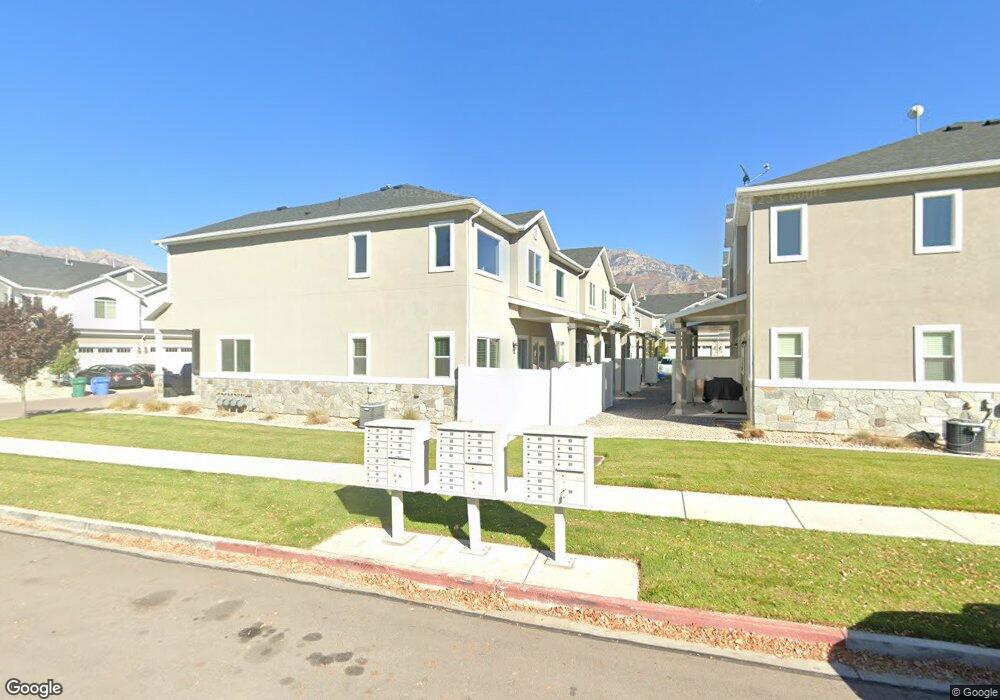
1139 S 225 E Orem, UT 84058
Westmore NeighborhoodEstimated Value: $454,766 - $486,000
3
Beds
2
Baths
1,624
Sq Ft
$287/Sq Ft
Est. Value
About This Home
This home is located at 1139 S 225 E, Orem, UT 84058 and is currently estimated at $466,589, approximately $287 per square foot. 1139 S 225 E is a home with nearby schools including Westmore Elementary School, Lakeridge Jr High School, and Mountain View High School.
Ownership History
Date
Name
Owned For
Owner Type
Purchase Details
Closed on
Apr 4, 2018
Sold by
Cameron Clinton Bruce and Cameron Marica Jones
Bought by
Argent Partners Llc
Current Estimated Value
Purchase Details
Closed on
Dec 22, 2016
Sold by
Orchard Heights Townhomes Llc
Bought by
Cameron Clinton Bruce and Cameron Marica Jones
Home Financials for this Owner
Home Financials are based on the most recent Mortgage that was taken out on this home.
Original Mortgage
$187,500
Interest Rate
3.94%
Mortgage Type
New Conventional
Purchase Details
Closed on
Jun 16, 2016
Sold by
Orchard Heights Townhomes Llc
Bought by
Building Dyanmics Inc
Home Financials for this Owner
Home Financials are based on the most recent Mortgage that was taken out on this home.
Original Mortgage
$182,200
Interest Rate
3.64%
Mortgage Type
Construction
Create a Home Valuation Report for This Property
The Home Valuation Report is an in-depth analysis detailing your home's value as well as a comparison with similar homes in the area
Home Values in the Area
Average Home Value in this Area
Purchase History
| Date | Buyer | Sale Price | Title Company |
|---|---|---|---|
| Argent Partners Llc | -- | None Available | |
| Cameron Clinton Bruce | -- | Cottonwood Title | |
| Orchard Heights Townhomes Llc | -- | Cottonwood Title Ins Ag | |
| Building Dyanmics Inc | -- | Cottonwood Title Ins Ag |
Source: Public Records
Mortgage History
| Date | Status | Borrower | Loan Amount |
|---|---|---|---|
| Previous Owner | Cameron Clinton Bruce | $187,500 | |
| Previous Owner | Building Dyanmics Inc | $182,200 |
Source: Public Records
Tax History
| Year | Tax Paid | Tax Assessment Tax Assessment Total Assessment is a certain percentage of the fair market value that is determined by local assessors to be the total taxable value of land and additions on the property. | Land | Improvement |
|---|---|---|---|---|
| 2025 | $1,972 | $244,420 | -- | -- |
| 2024 | $1,972 | $241,175 | $0 | $0 |
| 2023 | $1,781 | $234,080 | $0 | $0 |
| 2022 | $1,826 | $232,430 | $0 | $0 |
| 2021 | $1,648 | $317,800 | $47,700 | $270,100 |
| 2020 | $1,584 | $300,300 | $45,000 | $255,300 |
| 2019 | $1,467 | $289,100 | $43,400 | $245,700 |
| 2018 | $1,248 | $235,100 | $35,300 | $199,800 |
| 2017 | $1,282 | $129,305 | $0 | $0 |
Source: Public Records
Map
Nearby Homes
- 1133 S 225 E
- 1143 S 225 E
- 221 E 1135 S
- 1147 S 225 E
- 219 1135 S
- 216 E 1135 S
- 1151 S 225 E
- 215 E 1135 S
- 1123 S Graff Cir
- 1155 S 225 E
- 212 E 1135 S
- 1139 S Graff Cir
- 211 E 1135 S Unit 215
- 1159 S 225 E
- 208 E 1135 S Unit 219
- 207 E 1135 S Unit 216
- 222 E 1100 S
- 236 E 1100 S
- 204 E 1135 S Unit 218
- 203 E 1135 S
Your Personal Tour Guide
Ask me questions while you tour the home.