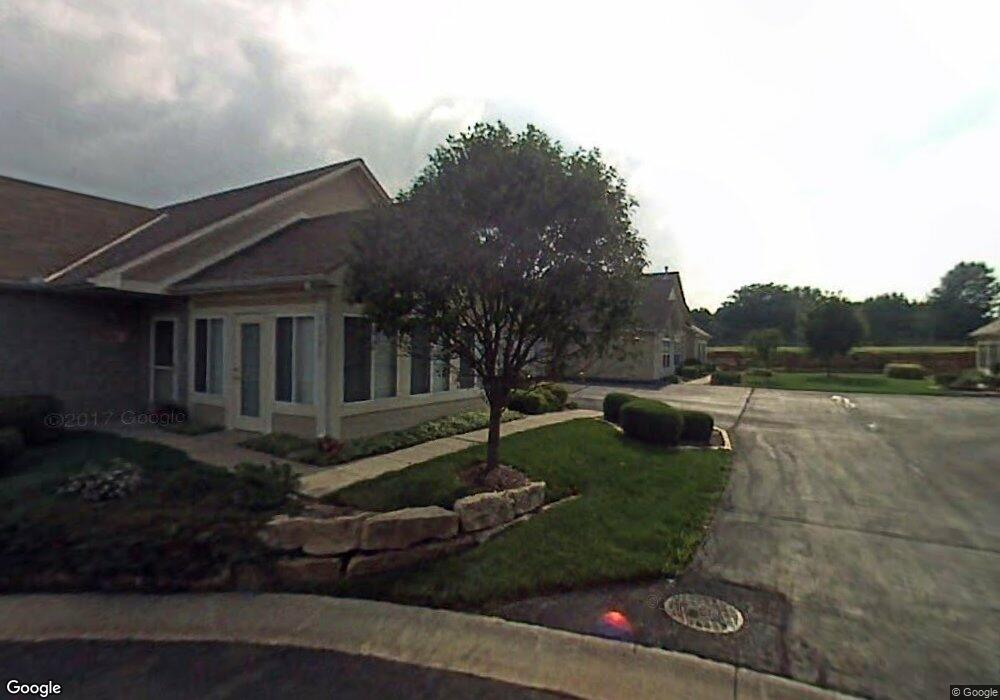
11394 Pflumm Rd Lenexa, KS 66215
Estimated Value: $336,000 - $379,000
3
Beds
2
Baths
1,464
Sq Ft
$247/Sq Ft
Est. Value
About This Home
This home is located at 11394 Pflumm Rd, Lenexa, KS 66215 and is currently estimated at $361,300, approximately $246 per square foot. 11394 Pflumm Rd is a home located in Johnson County with nearby schools including Walnut Grove Elementary School, Pioneer Trail Middle School, and Olathe East Sr High School.
Ownership History
Date
Name
Owned For
Owner Type
Purchase Details
Closed on
Sep 25, 2014
Sold by
Smith Cindy C and Geersen Lori A
Bought by
Sadler Walter P and Sadler Karen A
Current Estimated Value
Purchase Details
Closed on
Apr 24, 2003
Sold by
Moore Fred C and Moore Pamela M
Bought by
Geersen Lori A and Smith Cindy C
Home Financials for this Owner
Home Financials are based on the most recent Mortgage that was taken out on this home.
Original Mortgage
$148,800
Interest Rate
5.8%
Mortgage Type
Purchase Money Mortgage
Create a Home Valuation Report for This Property
The Home Valuation Report is an in-depth analysis detailing your home's value as well as a comparison with similar homes in the area
Home Values in the Area
Average Home Value in this Area
Purchase History
| Date | Buyer | Sale Price | Title Company |
|---|---|---|---|
| Sadler Walter P | -- | Alpha Title Llc | |
| Geersen Lori A | -- | Chicago Title Insurance Co |
Source: Public Records
Mortgage History
| Date | Status | Borrower | Loan Amount |
|---|---|---|---|
| Previous Owner | Geersen Lori A | $148,800 | |
| Closed | Geersen Lori A | $7,400 |
Source: Public Records
Tax History
| Year | Tax Paid | Tax Assessment Tax Assessment Total Assessment is a certain percentage of the fair market value that is determined by local assessors to be the total taxable value of land and additions on the property. | Land | Improvement |
|---|---|---|---|---|
| 2025 | $4,066 | $39,514 | $5,704 | $33,810 |
| 2024 | $4,066 | $36,398 | $5,428 | $30,970 |
| 2023 | $3,893 | $34,098 | $4,934 | $29,164 |
| 2022 | $3,745 | $31,890 | $4,934 | $26,956 |
| 2021 | $3,675 | $29,762 | $4,485 | $25,277 |
| 2020 | $3,422 | $27,485 | $3,749 | $23,736 |
| 2019 | $3,238 | $25,852 | $3,197 | $22,655 |
| 2018 | $2,926 | $23,230 | $3,197 | $20,033 |
| 2017 | $2,869 | $22,540 | $2,990 | $19,550 |
| 2016 | $2,612 | $21,068 | $2,990 | $18,078 |
| 2015 | $2,563 | $20,689 | $2,990 | $17,699 |
| 2013 | -- | $19,033 | $2,990 | $16,043 |
Source: Public Records
Map
Nearby Homes
- 13952 W 115th St
- 11512 Noland St
- 14036 W 113th St
- 14083 W 112th Terrace
- 14202 W 115th St
- 11812 S Carriage Rd
- 11813 S Hallet St
- 12825 W 117th St
- 14418 W 115th Terrace
- 12844 W 110th Terrace
- 12786 W 110th Terrace
- 12722 W 110th Terrace
- 11931 S Rene St
- 11903 Noland St
- 11827 Rosehill Rd
- 11943 S Hallet St
- 11912 Gillette St
- 10952 Bradshaw St
- 12604 W 110th Terrace
- 10907 Gillette St
- 11394 S Pflumm Rd
- 11396 S Pflumm Rd
- 11396 Pflumm Rd
- 11390 S Pflumm Rd
- 11392 Pflumm Rd
- 13518 W 115th St
- 11378 Pflumm Rd
- 11378 S Pflumm Rd
- 11374 S Pflumm Rd
- 11374 Pflumm Rd
- 11380 S Pflumm Rd
- 11380 Pflumm Rd
- 11376 Pflumm Rd
- 13510 W 115th St
- 11376 S Pflumm Rd
- 11382 Pflumm Rd
- 11384 Pflumm Rd
- 11384 S Pflumm Rd
- 11445 Rene St
- 11368 Pflumm Rd
Your Personal Tour Guide
Ask me questions while you tour the home.