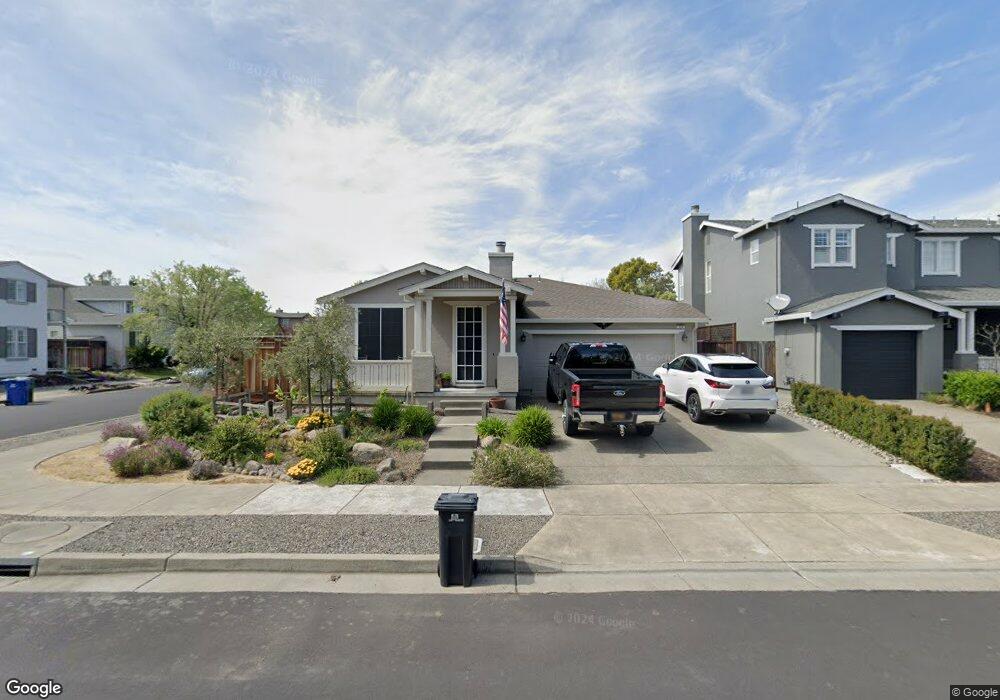
114 Decanter Cir Unit 3 Windsor, CA 95492
Estimated Value: $668,000 - $766,000
About This Home
This home is located at 114 Decanter Cir Unit 3, Windsor, CA 95492 and is currently estimated at $730,582, approximately $531 per square foot. 114 Decanter Cir Unit 3 is a home located in Sonoma County with nearby schools including Mattie Washburn Elementary School, Brooks Elementary School, and Windsor Middle School.
Ownership History
We collect this data history from publicly available records. To have your information removed, we recommend requesting removal directly through your county’s website.
Purchase Details
Purchase Details
Purchase Details
Purchase Details
Home Financials for this Owner
Home Financials are based on the most recent Mortgage that was taken out on this home.Home Values in the Area
Average Home Value in this Area
Purchase History
We collect this data history from publicly available records. To have your information removed, we recommend requesting removal directly through your county’s website.
| Date | Buyer | Sale Price | Title Company |
|---|---|---|---|
| -- | None Available | ||
| $345,000 | Fidelity National Title Co | ||
| -- | None Available | ||
| $314,000 | North American Title Co |
Mortgage History
We collect this data history from publicly available records. To have your information removed, we recommend requesting removal directly through your county’s website.
| Date | Status | Borrower | Loan Amount |
|---|---|---|---|
| Previous Owner | $250,800 |
Tax History
We collect this data history from publicly available records. To have your information removed, we recommend requesting removal directly through your county’s website.
| Year | Tax Paid | Tax Assessment Tax Assessment Total Assessment is a certain percentage of the fair market value that is determined by local assessors to be the total taxable value of land and additions on the property. | Land | Improvement |
|---|---|---|---|---|
| 2025 | $5,492 | $441,994 | $140,922 | $301,072 |
| 2024 | $5,374 | $433,328 | $138,159 | $295,169 |
| 2023 | $5,374 | $424,832 | $135,450 | $289,382 |
| 2022 | $5,183 | $416,503 | $132,795 | $283,708 |
| 2021 | $5,102 | $408,338 | $130,192 | $278,146 |
| 2020 | $5,213 | $404,152 | $128,858 | $275,294 |
| 2019 | $5,181 | $396,229 | $126,332 | $269,897 |
| 2018 | $5,133 | $388,460 | $123,855 | $264,605 |
| 2017 | $5,086 | $380,844 | $121,427 | $259,417 |
| 2016 | $4,764 | $373,378 | $119,047 | $254,331 |
| 2015 | $4,634 | $367,770 | $117,259 | $250,511 |
| 2014 | $4,565 | $360,567 | $114,963 | $245,604 |
Map
- 8396 Trione Cir
- 7811 Foppiano Way
- 8539 Zinfandel Dr
- 368 Decanter Cir
- 353 Patrick Ln
- 1168 Vintage Greens Dr
- 8603 Windsor Park Cir
- 500 Mark West Station Rd
- 1433 Birdie Dr
- 8843 Oakfield Ln
- 8149 D St
- 8145 Willow St
- 1038 Capewood Ln
- 1138 Broadleaf Ln
- 228 Johnson St
- 180 Johnson St
- 8148 D St
- 8156 D St
- 8174 Birch St
- 191 Johnson St
- 108 Decanter Cir
- 120 Decanter Cir
- 102 Decanter Cir
- 509 Cork St
- 115 Decanter Cir
- 126 Decanter Cir
- 109 Decanter Cir
- 121 Decanter Cir
- 515 Cork St
- 127 Decanter Cir
- 132 Decanter Cir
- 521 Cork St
- 133 Decanter Cir
- 734 Decanter Cir
- 1551 Reiman Ln
- 138 Decanter Cir
- 1565 Reiman Ln
- 506 Cork St
- 527 Cork St
- 139 Decanter Cir
Ask me questions while you tour the home.