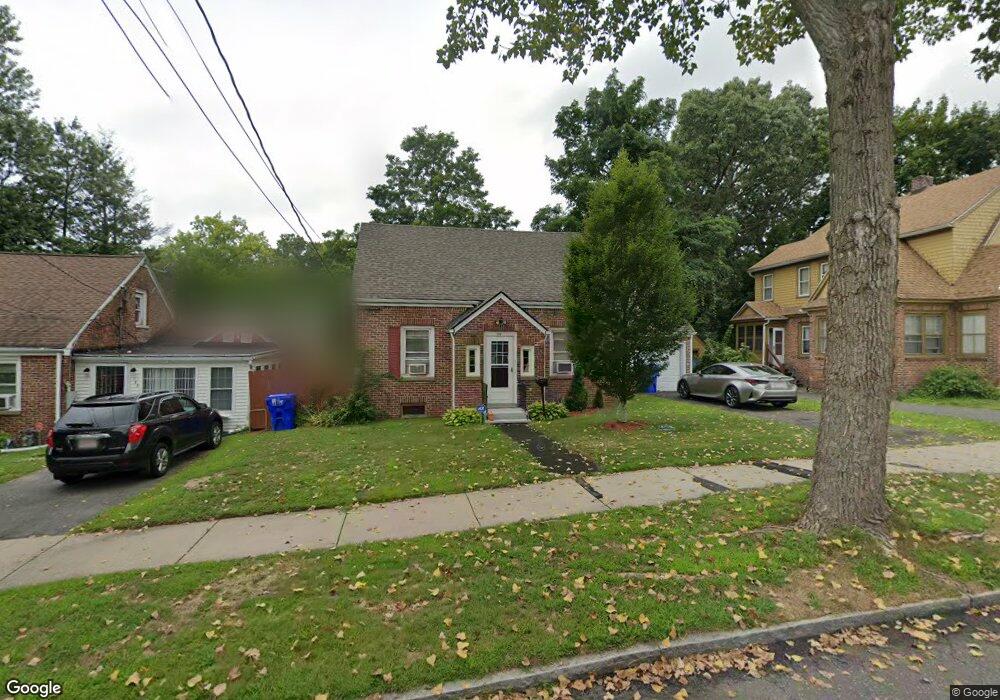
114 Fenwick St Unit 1 Springfield, MA 01109
Upper Hill NeighborhoodEstimated Value: $278,000 - $309,000
2
Beds
1
Bath
1,534
Sq Ft
$190/Sq Ft
Est. Value
About This Home
This home is located at 114 Fenwick St Unit 1, Springfield, MA 01109 and is currently estimated at $291,345, approximately $189 per square foot. 114 Fenwick St Unit 1 is a home located in Hampden County with nearby schools including John J Duggan Middle, Springfield High School of Science and Technology, and Roger L. Putnam Vocational Technical Academy.
Ownership History
Date
Name
Owned For
Owner Type
Purchase Details
Closed on
Oct 11, 2005
Sold by
Hung Tu T
Bought by
Laster Songa D and Laster Sonja D
Current Estimated Value
Home Financials for this Owner
Home Financials are based on the most recent Mortgage that was taken out on this home.
Original Mortgage
$138,320
Outstanding Balance
$74,268
Interest Rate
5.81%
Mortgage Type
Purchase Money Mortgage
Estimated Equity
$217,077
Purchase Details
Closed on
Jul 7, 1997
Sold by
Est Cains Alice and Walker Augustine
Bought by
Tu Hung T
Create a Home Valuation Report for This Property
The Home Valuation Report is an in-depth analysis detailing your home's value as well as a comparison with similar homes in the area
Home Values in the Area
Average Home Value in this Area
Purchase History
| Date | Buyer | Sale Price | Title Company |
|---|---|---|---|
| Laster Songa D | $145,600 | -- | |
| Tu Hung T | $31,250 | -- |
Source: Public Records
Mortgage History
| Date | Status | Borrower | Loan Amount |
|---|---|---|---|
| Open | Laster Songa D | $138,320 | |
| Previous Owner | Tu Hung T | $45,500 |
Source: Public Records
Tax History Compared to Growth
Tax History
| Year | Tax Paid | Tax Assessment Tax Assessment Total Assessment is a certain percentage of the fair market value that is determined by local assessors to be the total taxable value of land and additions on the property. | Land | Improvement |
|---|---|---|---|---|
| 2025 | $3,958 | $252,400 | $39,700 | $212,700 |
| 2024 | $3,872 | $241,100 | $33,000 | $208,100 |
| 2023 | $3,151 | $184,800 | $30,000 | $154,800 |
| 2022 | $3,437 | $182,600 | $28,100 | $154,500 |
| 2021 | $3,149 | $166,600 | $25,600 | $141,000 |
| 2020 | $2,898 | $148,400 | $25,600 | $122,800 |
| 2019 | $2,757 | $140,100 | $25,600 | $114,500 |
| 2018 | $2,826 | $143,600 | $25,600 | $118,000 |
| 2017 | $2,739 | $139,300 | $23,600 | $115,700 |
| 2016 | $2,355 | $119,800 | $23,600 | $96,200 |
| 2015 | $2,097 | $106,600 | $14,800 | $91,800 |
Source: Public Records
Map
Nearby Homes
- 867 Roosevelt Ave
- 67 Carlisle St
- 111 Marlborough St
- 75 Carnavon Cir
- 158 Norfolk St
- 135-137 Suffolk St
- 62-64 Bristol St
- 236 Pondview Dr
- 124-126 Westford Cir
- 43 Colonial Ave
- 0 NS (24) Alden St
- 179 Albemarle St
- 88 Dunmoreland St
- 204 Arcadia Blvd
- 21 Westford Cir
- 19 Westford Ave
- 63 Judith St
- 58 Willard Ave
- 54 S Shore Dr
- 74 Judith St
- 114 Fenwick St
- 108 Fenwick St
- 120 Fenwick St
- 104 Fenwick St
- 915 Roosevelt Ave
- 921 Roosevelt Ave
- 109 Fenwick St
- 119 Fenwick St Unit 2
- 98 Fenwick St Unit 100
- 111 Fenwick St Unit 113
- 117 Fenwick St Unit 119
- 117-119 Fenwick St
- 107 Fenwick St
- 903 Roosevelt Ave
- 130 Fenwick St
- 123 Fenwick St
- 92 Fenwick St Unit 94
- 92-94 Fenwick St
- 935 Roosevelt Ave
- 895 Roosevelt Ave