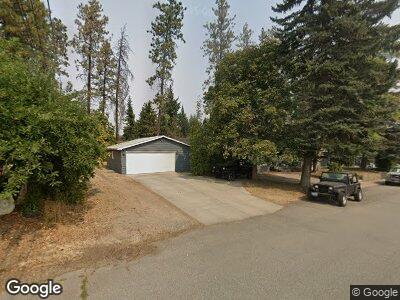
114 N 2nd St Cheney, WA 99004
Estimated Value: $335,000 - $375,000
3
Beds
2
Baths
1,563
Sq Ft
$224/Sq Ft
Est. Value
About This Home
This home is located at 114 N 2nd St, Cheney, WA 99004 and is currently estimated at $349,578, approximately $223 per square foot. 114 N 2nd St is a home located in Spokane County with nearby schools including Betz Elementary School, Cheney Middle School, and Cheney High School.
Ownership History
Date
Name
Owned For
Owner Type
Purchase Details
Closed on
Aug 8, 2012
Sold by
Chartier Richard M and Chartier Treana K
Bought by
Cox William D and Cox Margaret A
Current Estimated Value
Home Financials for this Owner
Home Financials are based on the most recent Mortgage that was taken out on this home.
Original Mortgage
$154,846
Interest Rate
3.53%
Mortgage Type
VA
Purchase Details
Closed on
Jul 20, 2010
Sold by
Luhn Levi R and Luhn Stacey M
Bought by
Chartier Richard M and Chartier Treana K
Home Financials for this Owner
Home Financials are based on the most recent Mortgage that was taken out on this home.
Original Mortgage
$147,020
Interest Rate
4.87%
Mortgage Type
FHA
Purchase Details
Closed on
Jul 10, 2000
Sold by
Nyman Arie J
Bought by
Luhn Levi R and Luhn Stacey M
Home Financials for this Owner
Home Financials are based on the most recent Mortgage that was taken out on this home.
Original Mortgage
$84,000
Interest Rate
7.75%
Create a Home Valuation Report for This Property
The Home Valuation Report is an in-depth analysis detailing your home's value as well as a comparison with similar homes in the area
Home Values in the Area
Average Home Value in this Area
Purchase History
| Date | Buyer | Sale Price | Title Company |
|---|---|---|---|
| Cox William D | $150,180 | First American Title Ins Co | |
| Chartier Richard M | $149,000 | Spokane County Title Co | |
| Luhn Levi R | $100,000 | First American Title Ins |
Source: Public Records
Mortgage History
| Date | Status | Borrower | Loan Amount |
|---|---|---|---|
| Open | Cox William D | $257,000 | |
| Closed | Cox William D | $159,463 | |
| Open | Cox William D | $17,044,500 | |
| Closed | Cox William D | $154,846 | |
| Previous Owner | Chartier Richard M | $147,020 | |
| Previous Owner | Luhn Levi R | $80,000 | |
| Previous Owner | Luhn Levi R | $84,000 |
Source: Public Records
Tax History Compared to Growth
Tax History
| Year | Tax Paid | Tax Assessment Tax Assessment Total Assessment is a certain percentage of the fair market value that is determined by local assessors to be the total taxable value of land and additions on the property. | Land | Improvement |
|---|---|---|---|---|
| 2024 | $3,466 | $314,300 | $80,000 | $234,300 |
| 2023 | $2,529 | $301,600 | $75,000 | $226,600 |
| 2022 | $1,115 | $301,600 | $75,000 | $226,600 |
| 2021 | $2,203 | $192,400 | $31,500 | $160,900 |
| 2020 | $2,131 | $174,400 | $30,000 | $144,400 |
| 2019 | $1,808 | $155,700 | $28,000 | $127,700 |
| 2018 | $2,067 | $155,000 | $28,000 | $127,000 |
| 2017 | $1,841 | $152,500 | $28,000 | $124,500 |
| 2016 | $1,745 | $139,200 | $28,000 | $111,200 |
| 2015 | $1,648 | $133,700 | $28,000 | $105,700 |
| 2014 | -- | $133,700 | $28,000 | $105,700 |
| 2013 | -- | $0 | $0 | $0 |
Source: Public Records
Map
Nearby Homes