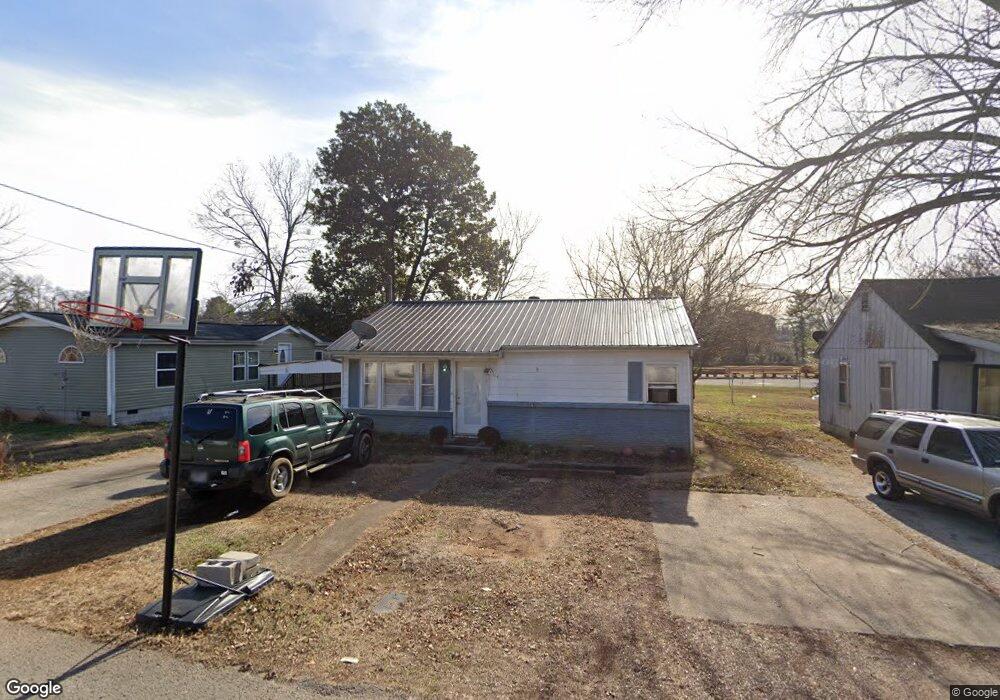
114 Noles St Decherd, TN 37324
Estimated Value: $133,913 - $208,000
Studio
2
Baths
1,152
Sq Ft
$152/Sq Ft
Est. Value
About This Home
This home is located at 114 Noles St, Decherd, TN 37324 and is currently estimated at $174,978, approximately $151 per square foot. 114 Noles St is a home located in Franklin County with nearby schools including North Middle School, Franklin County High School, and School of the Good Shepherd.
Ownership History
Date
Name
Owned For
Owner Type
Purchase Details
Closed on
Apr 10, 2025
Sold by
Heade Carl and Starie Maeann
Bought by
Bush John
Current Estimated Value
Purchase Details
Closed on
Dec 3, 2024
Sold by
Dodson Alisa and Heade Carl
Bought by
Heade Carl and Heade Starie Maeann
Purchase Details
Closed on
Oct 30, 1996
Sold by
Gifford Thelma R
Bought by
Heade Eusebius
Purchase Details
Closed on
Mar 20, 1993
Bought by
Gifford Thelma R
Purchase Details
Closed on
Jan 24, 1992
Bought by
Music Jack L & Shirley A
Purchase Details
Closed on
Mar 29, 1990
Bought by
Mason James L and Mason Rosemary
Purchase Details
Closed on
Apr 8, 1986
Bought by
Payton Charles W and Payton Lois J
Purchase Details
Closed on
Oct 11, 1966
Create a Home Valuation Report for This Property
The Home Valuation Report is an in-depth analysis detailing your home's value as well as a comparison with similar homes in the area
Purchase History
| Date | Buyer | Sale Price | Title Company |
|---|---|---|---|
| Bush John | -- | None Listed On Document | |
| Bush John | -- | None Listed On Document | |
| Heade Carl | -- | None Listed On Document | |
| Heade Carl | -- | None Listed On Document | |
| Heade Eusebius | $49,000 | -- | |
| Gifford Thelma R | $36,500 | -- | |
| Music Jack L & Shirley A | $31,500 | -- | |
| Mason James L | $26,000 | -- | |
| Payton Charles W | -- | -- | |
| -- | -- | -- |
Source: Public Records
Tax History
| Year | Tax Paid | Tax Assessment Tax Assessment Total Assessment is a certain percentage of the fair market value that is determined by local assessors to be the total taxable value of land and additions on the property. | Land | Improvement |
|---|---|---|---|---|
| 2025 | -- | $21,175 | $2,750 | $18,425 |
| 2024 | $0 | $21,175 | $2,750 | $18,425 |
| 2023 | $584 | $21,175 | $2,750 | $18,425 |
| 2022 | $552 | $21,175 | $2,750 | $18,425 |
| 2021 | $390 | $21,175 | $2,750 | $18,425 |
| 2020 | $558 | $13,900 | $1,100 | $12,800 |
| 2019 | $558 | $13,900 | $1,100 | $12,800 |
| 2018 | $529 | $13,900 | $1,100 | $12,800 |
| 2017 | $529 | $13,900 | $1,100 | $12,800 |
| 2016 | $512 | $13,450 | $1,100 | $12,350 |
| 2015 | $512 | $13,450 | $1,100 | $12,350 |
| 2014 | $511 | $13,436 | $0 | $0 |
Source: Public Records
Map
Nearby Homes
- 105 Lakeview Dr
- 210 E Petty Ln
- 201 10th Ave N
- 205 Mary Sharp Dr
- 114 Allen Dr
- 209 Franklin Park
- 208 Tammy Dr
- 111 Dogwood Ln
- 102 Dogwood Ln
- 203 5th Ave N
- 1105 Cumberland St Unit 1107
- 501 W Broad St
- 909 Cumberland St Unit 911
- 0 Sharp Springs Rd Unit RTC2980057
- 67 Edgefield Ct
- 405 Sharp Springs Rd
- 66 Edgefield Ct
- 202 W Main St
- 119 Highland Dr
- 44 Flint Dr
- 112 Noles St
- 110 Noles St
- 113 Noles St
- 115 Noles St
- 109 Noles St
- 120 Noles St
- 108 Noles St
- 117 Noles St
- 107 Noles St
- 125 Noles St
- 64 Decherd Boulevard 1754 1750
- 64 Decherd Blvd
- 340 Old Winchester Rd
- 101 Noles St Unit 1
- 101 Noles St
- 1806 Decherd Blvd
- 20 Sunrise Dr
- 503 E Petty Ln
- 324 Old Winchester Rd
- 0 Sunrise Dr
Your Personal Tour Guide
Ask me questions while you tour the home.