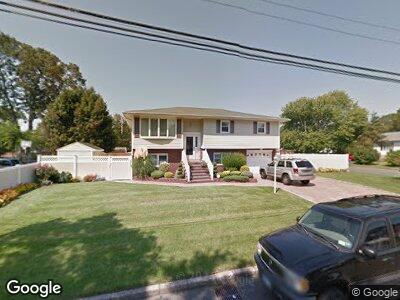
1140 4th St West Babylon, NY 11704
West Babylon NeighborhoodEstimated Value: $698,000 - $774,000
--
Bed
--
Bath
2,232
Sq Ft
$323/Sq Ft
Est. Value
About This Home
This home is located at 1140 4th St, West Babylon, NY 11704 and is currently estimated at $719,910, approximately $322 per square foot. 1140 4th St is a home located in Suffolk County with nearby schools including West Babylon Senior High School.
Ownership History
Date
Name
Owned For
Owner Type
Purchase Details
Closed on
May 13, 2022
Sold by
Hartmann Thomas W and Hartmann Denise B
Bought by
Hartmann Denise B
Current Estimated Value
Home Financials for this Owner
Home Financials are based on the most recent Mortgage that was taken out on this home.
Original Mortgage
$350,000
Interest Rate
5%
Mortgage Type
Stand Alone Refi Refinance Of Original Loan
Purchase Details
Closed on
Aug 17, 2007
Sold by
Aguayo Miguel A and Aguayo Keren
Bought by
Hartmann Thomas W and Hartmann Denise B
Purchase Details
Closed on
Sep 21, 2004
Sold by
Vallone Joseph A Patricia
Bought by
Aguayo Miguel A Keren
Create a Home Valuation Report for This Property
The Home Valuation Report is an in-depth analysis detailing your home's value as well as a comparison with similar homes in the area
Home Values in the Area
Average Home Value in this Area
Purchase History
| Date | Buyer | Sale Price | Title Company |
|---|---|---|---|
| Hartmann Denise B | -- | None Available | |
| Hartmann Denise B | -- | None Available | |
| Hartmann Thomas W | $465,000 | Mitchell Diamond | |
| Hartmann Thomas W | $465,000 | Mitchell Diamond | |
| Aguayo Miguel A Keren | $425,000 | Gerard Glass | |
| Aguayo Miguel A Keren | $425,000 | Gerard Glass |
Source: Public Records
Mortgage History
| Date | Status | Borrower | Loan Amount |
|---|---|---|---|
| Previous Owner | Hartmann Denise B | $350,000 | |
| Previous Owner | Hartmann Thomas W | $12,688 | |
| Previous Owner | Vallone Joseph A | $70,000 |
Source: Public Records
Tax History Compared to Growth
Tax History
| Year | Tax Paid | Tax Assessment Tax Assessment Total Assessment is a certain percentage of the fair market value that is determined by local assessors to be the total taxable value of land and additions on the property. | Land | Improvement |
|---|---|---|---|---|
| 2024 | $13,996 | $3,690 | $340 | $3,350 |
| 2023 | $13,996 | $3,690 | $340 | $3,350 |
| 2022 | $10,757 | $3,690 | $340 | $3,350 |
| 2021 | $10,757 | $3,690 | $340 | $3,350 |
| 2020 | $11,197 | $3,690 | $340 | $3,350 |
| 2019 | $11,197 | $0 | $0 | $0 |
| 2018 | $10,671 | $3,690 | $340 | $3,350 |
| 2017 | $10,671 | $3,690 | $340 | $3,350 |
| 2016 | $10,647 | $3,690 | $340 | $3,350 |
| 2015 | -- | $3,690 | $340 | $3,350 |
| 2014 | -- | $4,070 | $340 | $3,730 |
Source: Public Records
Map
Nearby Homes