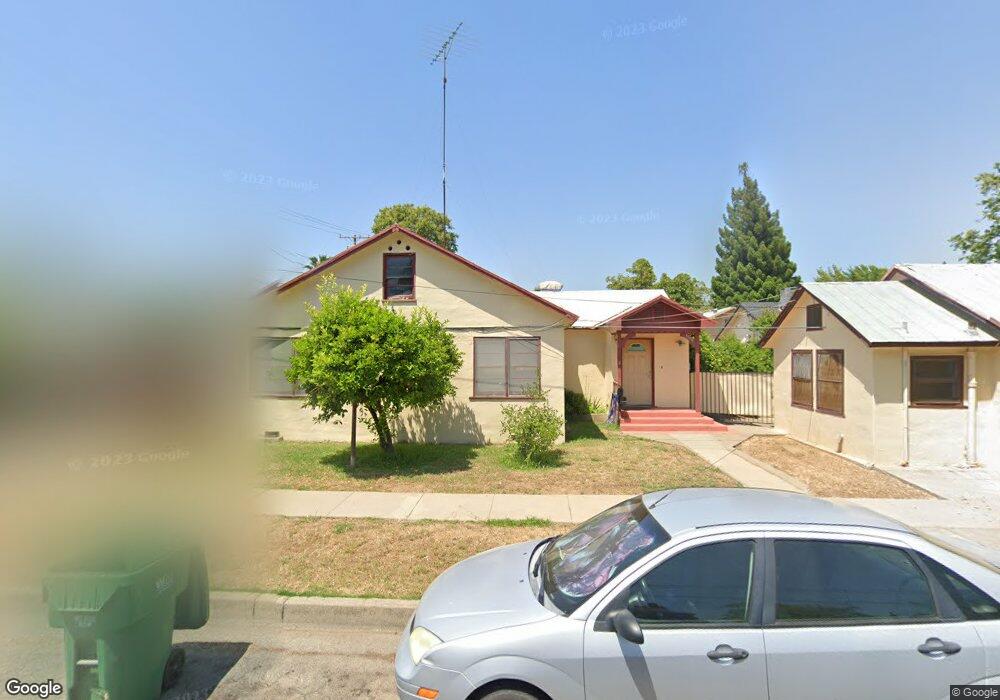
1140 Laurel St Gridley, CA 95948
Estimated Value: $264,000 - $328,000
2
Beds
1
Bath
1,156
Sq Ft
$253/Sq Ft
Est. Value
About This Home
This home is located at 1140 Laurel St, Gridley, CA 95948 and is currently estimated at $292,170, approximately $252 per square foot. 1140 Laurel St is a home located in Butte County with nearby schools including McKinley Elementary School, Wilson Elementary School, and Sycamore Middle School.
Ownership History
Date
Name
Owned For
Owner Type
Purchase Details
Closed on
Dec 6, 2005
Sold by
Radley Lewin J and Radley Christel
Bought by
Chavez Miguel
Current Estimated Value
Home Financials for this Owner
Home Financials are based on the most recent Mortgage that was taken out on this home.
Original Mortgage
$164,000
Outstanding Balance
$96,904
Interest Rate
7.25%
Mortgage Type
Fannie Mae Freddie Mac
Estimated Equity
$195,266
Purchase Details
Closed on
Apr 25, 2005
Sold by
Harmon Nancy
Bought by
Radley Lewis J and Radley Christel
Purchase Details
Closed on
Apr 23, 2002
Sold by
Radley Violetta L
Bought by
Radley Lewis J and Radley Christel
Create a Home Valuation Report for This Property
The Home Valuation Report is an in-depth analysis detailing your home's value as well as a comparison with similar homes in the area
Home Values in the Area
Average Home Value in this Area
Purchase History
| Date | Buyer | Sale Price | Title Company |
|---|---|---|---|
| Chavez Miguel | $205,000 | Bidwell Title & Escrow Co | |
| Radley Lewis J | -- | -- | |
| Radley Lewis J | -- | -- |
Source: Public Records
Mortgage History
| Date | Status | Borrower | Loan Amount |
|---|---|---|---|
| Open | Chavez Miguel | $164,000 |
Source: Public Records
Tax History
| Year | Tax Paid | Tax Assessment Tax Assessment Total Assessment is a certain percentage of the fair market value that is determined by local assessors to be the total taxable value of land and additions on the property. | Land | Improvement |
|---|---|---|---|---|
| 2025 | $3,047 | $280,130 | $122,982 | $157,148 |
| 2024 | $3,047 | $274,638 | $120,571 | $154,067 |
| 2023 | $3,031 | $269,254 | $118,207 | $151,047 |
| 2022 | $2,643 | $245,000 | $95,000 | $150,000 |
| 2021 | $2,631 | $245,000 | $90,000 | $155,000 |
| 2020 | $2,128 | $195,000 | $85,000 | $110,000 |
| 2019 | $1,762 | $155,000 | $70,000 | $85,000 |
| 2018 | $1,660 | $150,000 | $65,000 | $85,000 |
| 2017 | $1,608 | $145,000 | $50,000 | $95,000 |
| 2016 | $1,523 | $140,000 | $45,000 | $95,000 |
| 2015 | $1,435 | $125,000 | $40,000 | $85,000 |
| 2014 | $1,344 | $116,000 | $30,000 | $86,000 |
Source: Public Records
Map
Nearby Homes
Your Personal Tour Guide
Ask me questions while you tour the home.