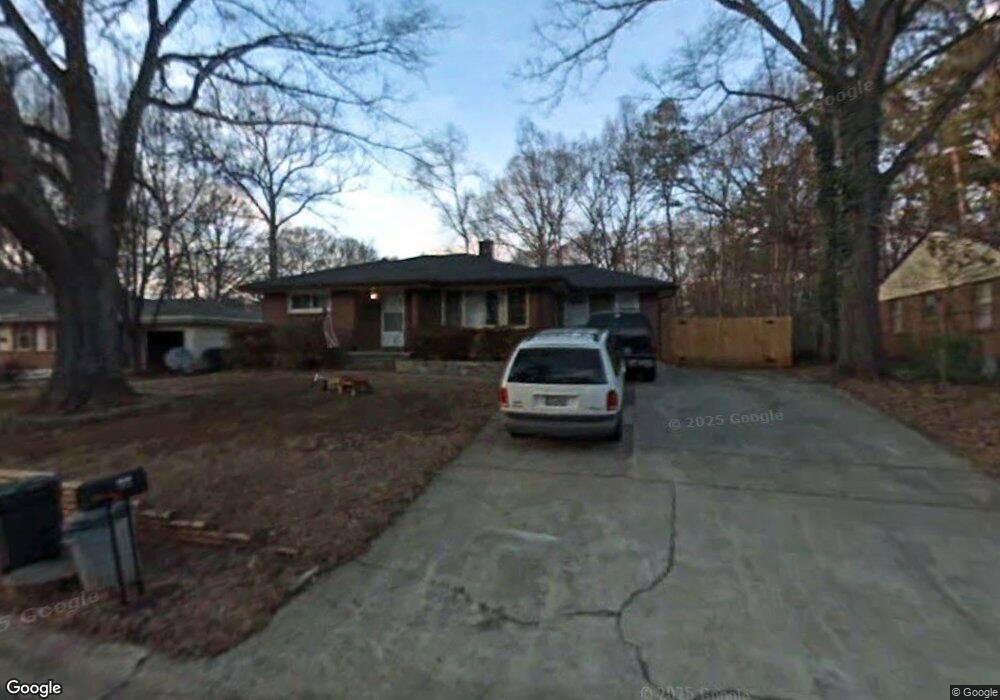
1141 Pinehurst Dr SE Smyrna, GA 30080
Estimated Value: $514,580 - $652,000
3
Beds
3
Baths
2,272
Sq Ft
$257/Sq Ft
Est. Value
About This Home
This home is located at 1141 Pinehurst Dr SE, Smyrna, GA 30080 and is currently estimated at $583,645, approximately $256 per square foot. 1141 Pinehurst Dr SE is a home located in Cobb County with nearby schools including Smyrna Elementary School, Campbell Middle School, and Campbell High School.
Ownership History
Date
Name
Owned For
Owner Type
Purchase Details
Closed on
Oct 21, 2021
Sold by
Davis Robinson Gregory
Bought by
Robinson Living Trust
Current Estimated Value
Purchase Details
Closed on
May 23, 2012
Sold by
Robinson Gregory Davis
Bought by
Robinson Gregory Davis and Robinson Maria Katia
Purchase Details
Closed on
May 29, 1998
Sold by
Otto Steven R
Bought by
Robinson Gregory D
Home Financials for this Owner
Home Financials are based on the most recent Mortgage that was taken out on this home.
Original Mortgage
$108,850
Interest Rate
7.15%
Mortgage Type
FHA
Purchase Details
Closed on
Jun 20, 1995
Sold by
Morrie Erwin G Mernie
Bought by
Otto Steven R
Create a Home Valuation Report for This Property
The Home Valuation Report is an in-depth analysis detailing your home's value as well as a comparison with similar homes in the area
Home Values in the Area
Average Home Value in this Area
Purchase History
| Date | Buyer | Sale Price | Title Company |
|---|---|---|---|
| Robinson Living Trust | -- | Jpg Law Llc | |
| Robinson Gregory Davis | -- | -- | |
| Robinson Gregory D | $109,000 | -- | |
| Otto Steven R | $89,000 | -- |
Source: Public Records
Mortgage History
| Date | Status | Borrower | Loan Amount |
|---|---|---|---|
| Previous Owner | Robinson Gregory D | $108,850 | |
| Closed | Otto Steven R | $0 |
Source: Public Records
Tax History Compared to Growth
Tax History
| Year | Tax Paid | Tax Assessment Tax Assessment Total Assessment is a certain percentage of the fair market value that is determined by local assessors to be the total taxable value of land and additions on the property. | Land | Improvement |
|---|---|---|---|---|
| 2025 | $4,428 | $230,756 | $60,000 | $170,756 |
| 2024 | $4,428 | $230,756 | $60,000 | $170,756 |
| 2023 | $2,821 | $171,012 | $60,000 | $111,012 |
| 2022 | $3,362 | $172,036 | $34,000 | $138,036 |
| 2021 | $2,760 | $139,216 | $34,000 | $105,216 |
| 2020 | $2,232 | $111,460 | $32,000 | $79,460 |
| 2019 | $1,978 | $98,136 | $30,000 | $68,136 |
| 2018 | $1,858 | $91,836 | $30,000 | $61,836 |
| 2017 | $1,699 | $86,644 | $30,000 | $56,644 |
| 2016 | $1,622 | $82,364 | $28,000 | $54,364 |
| 2015 | $1,524 | $75,804 | $26,000 | $49,804 |
| 2014 | $1,455 | $71,640 | $0 | $0 |
Source: Public Records
Map
Nearby Homes
- 3215 Concord Cir SE
- 1060 Pinedale Dr SE
- 1044 Pinedale Dr SE
- 1005 Pinedale Dr SE
- 3364 Dunn St SE
- 984 Valley Dr SE
- 1042 Oakdale Dr SE
- 1121 Dell Ave SE
- 3133 Dunton St SE
- 1019 Magbee Dr SE
- 982 Oakdale Dr SE
- 1060 Mclinden Ave SE
- 3086 Nichols St SE
- 3324 Pretty Branch Dr SE
- 3543 S Cobb Dr SE
- 1261 Cliffwood Dr SE
- 1000 Clifton Cir SE
- 1024 Magnolia Dr SE
- 3091 Clifton Rd SE
- 1151 Pinehurst Dr SE
- 1133 Pinehurst Dr SE
- 1125 Pinehurst Dr SE
- 3273 Concord Cir SE
- 1142 Pinehurst Dr SE
- 1159 Pinehurst Dr SE
- 1134 Pinehurst Dr SE
- 1150 SE 1150 Pinehurst Dr SE
- 1150 Pinehurst Dr SE
- 1126 Pinehurst Dr SE
- 1115 Pinehurst Dr SE
- 3279 Concord Cir SE
- 1169 Pinehurst Dr SE
- 1160 Pinehurst Dr SE
- 3269 Concord Cir SE
- 1175 Pinehurst Dr SE
- 3285 Concord Cir SE
- 1114 Pinehurst Dr SE
- 1170 Pinehurst Dr SE
- 1105 Pinehurst Dr SE