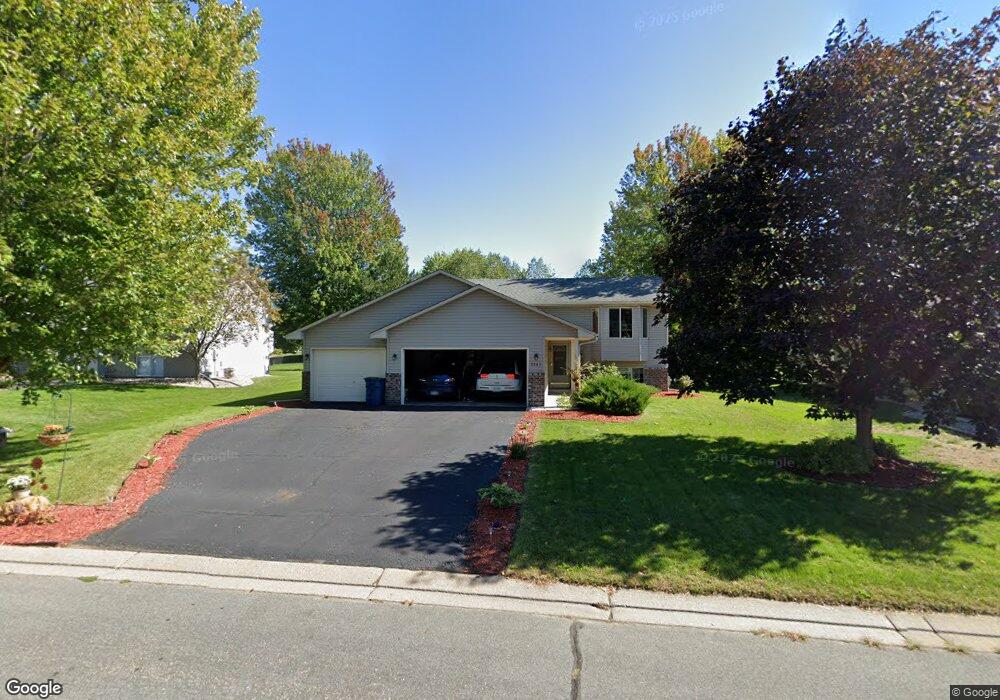
1141 Scott St S Shakopee, MN 55379
Estimated Value: $373,000 - $396,000
3
Beds
2
Baths
1,862
Sq Ft
$205/Sq Ft
Est. Value
About This Home
This home is located at 1141 Scott St S, Shakopee, MN 55379 and is currently estimated at $382,239, approximately $205 per square foot. 1141 Scott St S is a home located in Scott County with nearby schools including Sweeney Elementary School, East Middle School, and Shakopee Senior High School.
Ownership History
Date
Name
Owned For
Owner Type
Purchase Details
Closed on
Jan 29, 2020
Sold by
Opendoor Property Trust I
Bought by
Petersen Keri and Petersen Samuel
Current Estimated Value
Home Financials for this Owner
Home Financials are based on the most recent Mortgage that was taken out on this home.
Original Mortgage
$294,566
Outstanding Balance
$260,917
Interest Rate
3.62%
Mortgage Type
FHA
Estimated Equity
$121,322
Purchase Details
Closed on
Jul 11, 2019
Sold by
Domask Jason D and Domask Tina M
Bought by
Opendoor Property Trust I
Purchase Details
Closed on
Jan 26, 2007
Sold by
Everson Brian and Everson Heather
Bought by
Domask Jason D
Purchase Details
Closed on
Sep 9, 1998
Sold by
Gold Nugget Development Inc
Bought by
Novak-Fleck Inc
Create a Home Valuation Report for This Property
The Home Valuation Report is an in-depth analysis detailing your home's value as well as a comparison with similar homes in the area
Home Values in the Area
Average Home Value in this Area
Purchase History
| Date | Buyer | Sale Price | Title Company |
|---|---|---|---|
| Petersen Keri | $300,000 | North American Title Company | |
| Opendoor Property Trust I | $287,100 | Opendoor Title Llc | |
| Domask Jason D | $275,000 | -- | |
| Novak-Fleck Inc | $42,900 | -- | |
| Everson Brian J | $125,745 | -- |
Source: Public Records
Mortgage History
| Date | Status | Borrower | Loan Amount |
|---|---|---|---|
| Open | Petersen Keri | $294,566 |
Source: Public Records
Tax History Compared to Growth
Tax History
| Year | Tax Paid | Tax Assessment Tax Assessment Total Assessment is a certain percentage of the fair market value that is determined by local assessors to be the total taxable value of land and additions on the property. | Land | Improvement |
|---|---|---|---|---|
| 2025 | $3,466 | $355,700 | $176,000 | $179,700 |
| 2024 | $3,534 | $341,700 | $171,300 | $170,400 |
| 2023 | $3,712 | $335,900 | $167,900 | $168,000 |
| 2022 | $3,526 | $346,200 | $167,900 | $178,300 |
| 2021 | $2,982 | $286,600 | $136,000 | $150,600 |
| 2020 | $3,144 | $268,000 | $116,500 | $151,500 |
| 2019 | $2,974 | $250,800 | $102,000 | $148,800 |
| 2018 | $3,068 | $0 | $0 | $0 |
| 2016 | $2,814 | $0 | $0 | $0 |
| 2014 | -- | $0 | $0 | $0 |
Source: Public Records
Map
Nearby Homes
- 621 Menke Ave
- 348 Columbine Ln
- 921 Holmes St S
- 764 Monnens Ave
- 786 Regent Dr
- 335 Bluestem Ave
- 612 11th Ave E
- 414 4th Ave W
- 723 5th Ave W
- 528 Shakopee Ave E
- 1286 Jefferson Ct
- 120 4th Ave E
- 291 Appleblossom Ln
- 793 Lupine Ct
- 539 7th Ave E
- 508 Hackney Ave
- 1187 Jackson St S
- 1538 12th Ave W
- 1562 Liberty Cir Unit 2403
- 674 Jutland Ave
- 1131 Scott St S
- 1151 Scott St S
- 1154 Atwood St S
- 1164 Atwood St S
- 1144 Atwood St S
- 305 Thomas Ave
- 1128 Scott St S
- 1134 Atwood St S
- 1138 Scott St S
- 315 Thomas Ave
- 1111 Scott St S
- 1118 Scott St S
- 1124 Atwood St S
- 487 Thomas Ave
- 1114 Atwood St S
- 1108 Scott St S
- 1135 Apgar St S
- 481 Hennes Ave
- 1141 Atwood St S
- 1125 Apgar St S