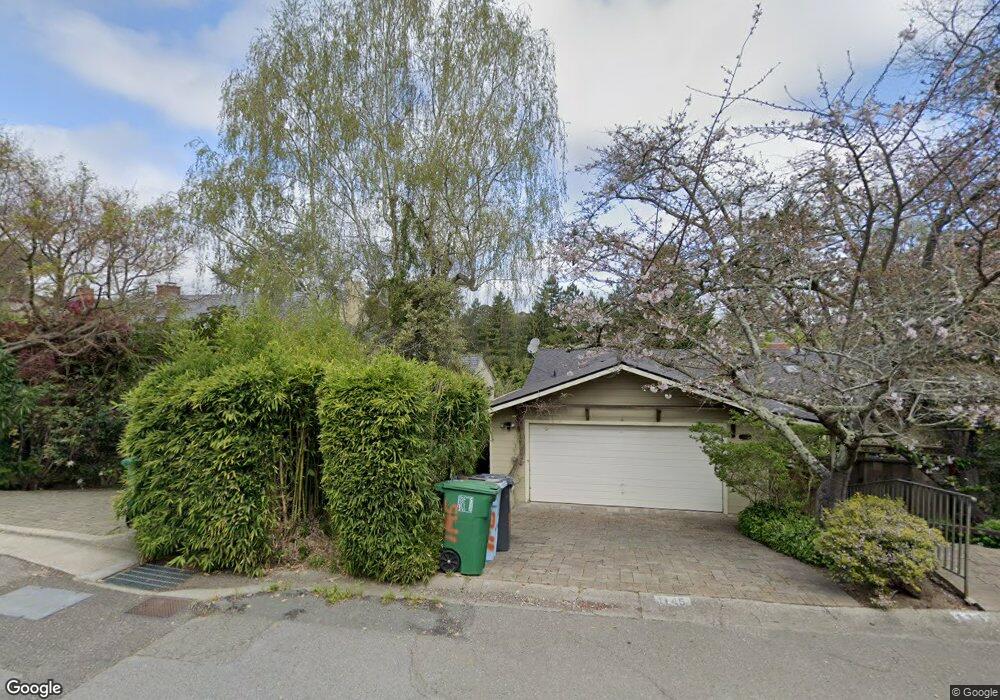
1141 Woodside Rd Berkeley, CA 94708
Berkeley Hills NeighborhoodEstimated Value: $1,497,000 - $1,869,040
3
Beds
4
Baths
2,711
Sq Ft
$589/Sq Ft
Est. Value
About This Home
This home is located at 1141 Woodside Rd, Berkeley, CA 94708 and is currently estimated at $1,598,010, approximately $589 per square foot. 1141 Woodside Rd is a home located in Alameda County with nearby schools including Cragmont Elementary School, Berkeley Arts Magnet at Whittier School, and Washington Elementary School.
Create a Home Valuation Report for This Property
The Home Valuation Report is an in-depth analysis detailing your home's value as well as a comparison with similar homes in the area
Home Values in the Area
Average Home Value in this Area
Tax History
| Year | Tax Paid | Tax Assessment Tax Assessment Total Assessment is a certain percentage of the fair market value that is determined by local assessors to be the total taxable value of land and additions on the property. | Land | Improvement |
|---|---|---|---|---|
| 2025 | $11,057 | $452,726 | $265,220 | $194,506 |
| 2024 | $11,057 | $443,712 | $260,019 | $190,693 |
| 2023 | $10,740 | $441,875 | $254,921 | $186,954 |
| 2022 | $10,626 | $426,211 | $249,923 | $183,288 |
| 2021 | $10,599 | $417,719 | $245,024 | $179,695 |
| 2020 | $9,893 | $420,365 | $242,512 | $177,853 |
| 2019 | $9,335 | $412,123 | $237,757 | $174,366 |
| 2018 | $9,107 | $404,042 | $233,095 | $170,947 |
| 2017 | $8,768 | $396,121 | $228,525 | $167,596 |
| 2016 | $8,343 | $388,355 | $224,045 | $164,310 |
| 2015 | $8,194 | $382,523 | $220,680 | $161,843 |
| 2014 | $8,013 | $375,031 | $216,358 | $158,673 |
Source: Public Records
Map
Nearby Homes
- 1221 Grizzly Peak Blvd
- 1160 Miller Ave
- 1085 Creston Rd
- 1110 Sterling Ave
- 1155 Keeler Ave
- 1165 Cragmont Ave
- 1024 Grizzly Peak Blvd
- 1375 Queens Rd
- 1106 Cragmont Ave
- 935 Grizzly Peak Blvd
- 2686 Shasta Rd
- 230 Fairlawn Dr
- 962 Regal Rd
- 730 Wildcat Canyon Rd
- 1004 Cragmont Ave
- 2501 Rose Walk
- 2315 Eunice St
- 938 San Benito Rd
- 777 Cragmont Ave
- 2600 Hilgard Ave
- 1100 Hillview Rd
- 1145 Woodside Rd
- 1125 Woodside Rd
- 1114 Hillview Rd
- 1138 Woodside Rd
- 1120 Hillview Rd
- 1119 Woodside Rd
- 1112 Hillview Rd
- 1142 Woodside Rd
- 1151 Woodside Rd
- 1128 Woodside Rd
- 1146 Woodside Rd
- 1124 Woodside Rd
- 1115 Woodside Rd
- 1124 Hillview Rd
- 1141 Park Hills Rd
- 1145 Park Hills Rd
- 1120 Woodside Rd
- 1115 Hillview Rd
- 1147 Park Hills Rd
Your Personal Tour Guide
Ask me questions while you tour the home.