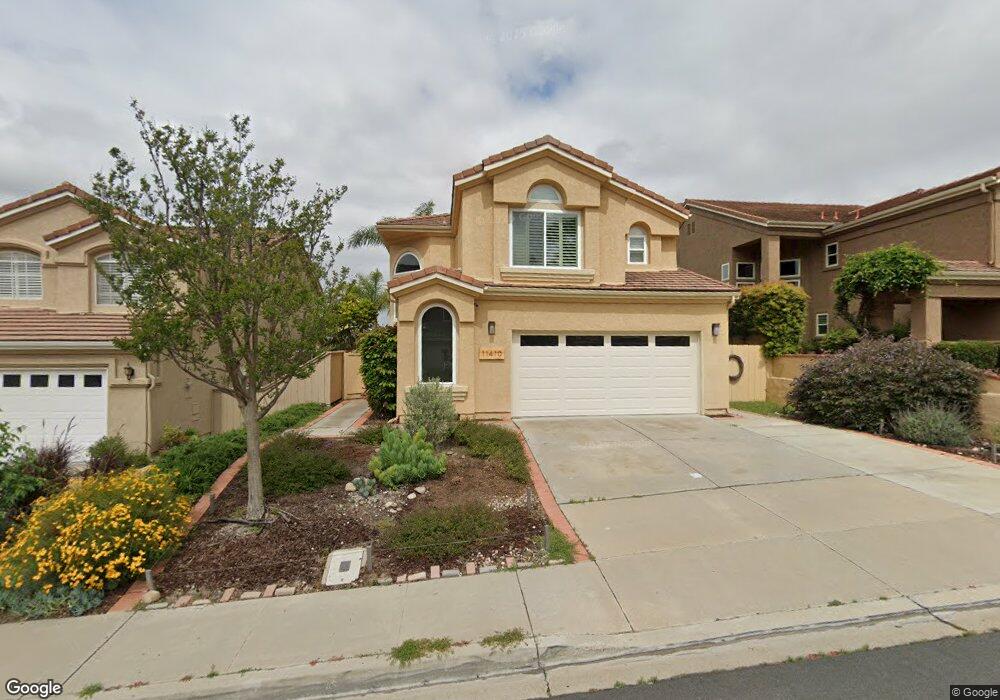
11410 Via Playa de Cortes San Diego, CA 92124
Tierrasanta NeighborhoodEstimated Value: $1,243,060 - $1,416,000
4
Beds
3
Baths
2,104
Sq Ft
$635/Sq Ft
Est. Value
About This Home
This home is located at 11410 Via Playa de Cortes, San Diego, CA 92124 and is currently estimated at $1,336,515, approximately $635 per square foot. 11410 Via Playa de Cortes is a home located in San Diego County with nearby schools including Kumeyaay Elementary School, De Portola Middle School, and Farb Middle School.
Ownership History
Date
Name
Owned For
Owner Type
Purchase Details
Closed on
Nov 3, 2017
Sold by
Broadhurst Allan D and Walsh Janis I
Bought by
Walsh Broadhurst A and Walsh Janis I
Current Estimated Value
Purchase Details
Closed on
Apr 25, 2013
Sold by
Dykeman Stephen
Bought by
Broadhurst Allan D and Walsh Janis I
Home Financials for this Owner
Home Financials are based on the most recent Mortgage that was taken out on this home.
Original Mortgage
$415,000
Outstanding Balance
$292,136
Interest Rate
3.41%
Mortgage Type
New Conventional
Estimated Equity
$1,044,379
Purchase Details
Closed on
May 16, 2002
Sold by
Dykeman Elizabeth
Bought by
Dykeman Stephen
Home Financials for this Owner
Home Financials are based on the most recent Mortgage that was taken out on this home.
Original Mortgage
$100,000
Interest Rate
7.13%
Purchase Details
Closed on
Mar 17, 2000
Sold by
Hofmockel John L and Hofmockel Marcia L
Bought by
Dykeman Stephen
Home Financials for this Owner
Home Financials are based on the most recent Mortgage that was taken out on this home.
Original Mortgage
$100,000
Interest Rate
8.22%
Purchase Details
Closed on
Oct 10, 1991
Create a Home Valuation Report for This Property
The Home Valuation Report is an in-depth analysis detailing your home's value as well as a comparison with similar homes in the area
Home Values in the Area
Average Home Value in this Area
Purchase History
| Date | Buyer | Sale Price | Title Company |
|---|---|---|---|
| Walsh Broadhurst A | -- | None Available | |
| Broadhurst Allan D | $630,000 | Equity Title San Diego | |
| Dykeman Stephen | -- | American Title Co | |
| Dykeman Stephen | $400,000 | Chicago Title Co | |
| -- | $280,000 | -- |
Source: Public Records
Mortgage History
| Date | Status | Borrower | Loan Amount |
|---|---|---|---|
| Open | Broadhurst Allan D | $415,000 | |
| Previous Owner | Dykeman Stephen | $100,000 | |
| Previous Owner | Dykeman Stephen | $100,000 |
Source: Public Records
Tax History Compared to Growth
Tax History
| Year | Tax Paid | Tax Assessment Tax Assessment Total Assessment is a certain percentage of the fair market value that is determined by local assessors to be the total taxable value of land and additions on the property. | Land | Improvement |
|---|---|---|---|---|
| 2025 | $9,390 | $775,787 | $250,516 | $525,271 |
| 2024 | $9,390 | $760,576 | $245,604 | $514,972 |
| 2023 | $9,179 | $745,664 | $240,789 | $504,875 |
| 2022 | $8,929 | $731,044 | $236,068 | $494,976 |
| 2021 | $8,862 | $716,711 | $231,440 | $485,271 |
| 2020 | $8,753 | $709,363 | $229,067 | $480,296 |
| 2019 | $8,596 | $695,455 | $224,576 | $470,879 |
| 2018 | $8,037 | $681,820 | $220,173 | $461,647 |
| 2017 | $7,844 | $668,452 | $215,856 | $452,596 |
| 2016 | $7,718 | $655,346 | $211,624 | $443,722 |
| 2015 | $7,602 | $645,503 | $208,446 | $437,057 |
| 2014 | $7,498 | $632,859 | $204,363 | $428,496 |
Source: Public Records
Map
Nearby Homes
- 4848 Casals Place
- 4989 Corte Playa Encino
- 4734 Ocana Place Unit 1
- 6161 Calle Mariselda Unit 408
- 6151 Calle Mariselda Unit 302
- 10812 Lamentin Ct Unit 312
- 10862 Caravelle Place
- 5137 Abuela Dr
- 5848 Antigua Blvd
- 10829 Macouba Place
- 5059 La Cuenta Dr
- 10852 Carbet Place
- 5562 Tortuga Ct
- 11655 Cebada Ct
- 5679 Antigua Blvd
- 4999 Paguera Ct
- 11464 Azucena Dr
- 11233 Tierrasanta Blvd Unit 30
- 11283 Cascada Way
- 10165 Gayuba Ln Unit 311
- 11418 Via Playa de Cortes
- 11404 Via Playa de Cortes
- 11424 Via Playa de Cortes
- 11398 Via Playa de Cortes Unit 1
- 11432 Via Playa de Cortes
- 11390 Via Playa de Cortes
- 11405 Via Playa de Cortes
- 11397 Via Playa de Cortes
- 11413 Via Playa de Cortes
- 11438 Via Playa de Cortes
- 11423 Via Playa de Cortes
- 11382 Via Playa de Cortes
- 11431 Via Playa de Cortes Unit 1
- 11381 Via Playa de Cortes
- 11446 Via Playa de Cortes
- 11374 Via Playa de Cortes
- 11441 Via Playa de Cortes
- 11373 Via Playa de Cortes
- 11452 Via Playa de Cortes
- 11449 Via Playa de Cortes