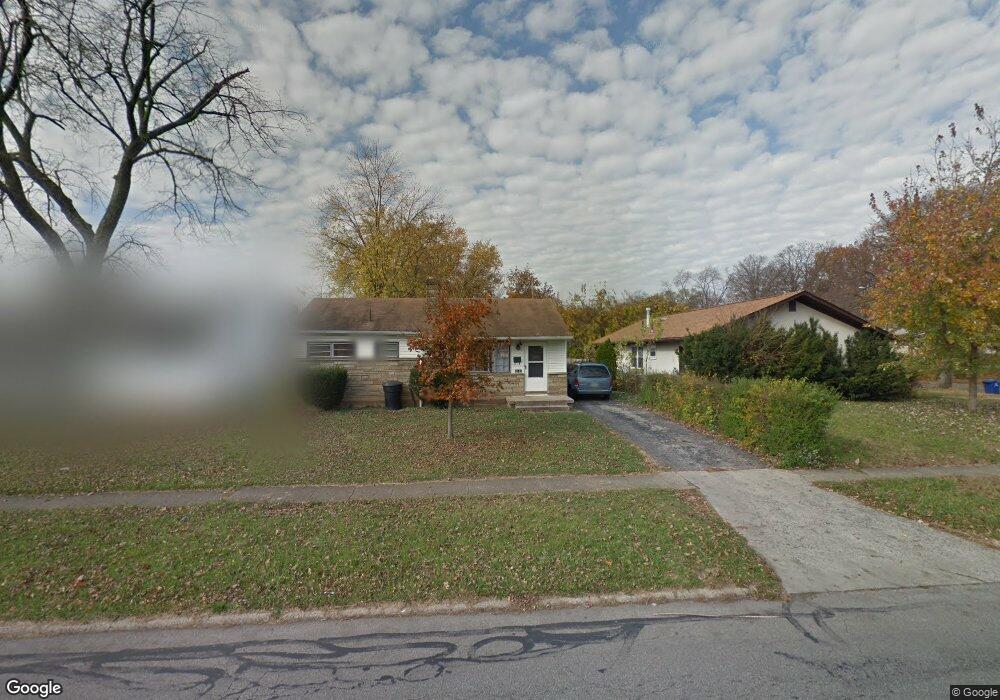
1143 Beechwood Rd Columbus, OH 43227
Beechwood NeighborhoodEstimated Value: $141,000 - $161,836
1
Bed
1
Bath
864
Sq Ft
$178/Sq Ft
Est. Value
About This Home
This home is located at 1143 Beechwood Rd, Columbus, OH 43227 and is currently estimated at $153,459, approximately $177 per square foot. 1143 Beechwood Rd is a home located in Franklin County with nearby schools including Shady Lane Elementary School, Sherwood Middle School, and Walnut Ridge High School.
Ownership History
Date
Name
Owned For
Owner Type
Purchase Details
Closed on
Jun 24, 2015
Sold by
Quinn John F and Quinn Betty L
Bought by
Quinn John F and Quinn Betty L
Current Estimated Value
Purchase Details
Closed on
Apr 11, 2005
Sold by
John F Quinn Trust
Bought by
Mayes Ferlando
Home Financials for this Owner
Home Financials are based on the most recent Mortgage that was taken out on this home.
Original Mortgage
$92,900
Interest Rate
8.8%
Mortgage Type
Seller Take Back
Purchase Details
Closed on
May 13, 2003
Sold by
Quinn John F
Bought by
Quinn John F
Purchase Details
Closed on
Apr 8, 2003
Sold by
Turnkey 2000 Ltd
Bought by
Quinn John F
Purchase Details
Closed on
Apr 1, 2003
Sold by
Brown Henry E
Bought by
Turnkey 2000 Ltd
Purchase Details
Closed on
Aug 21, 1985
Bought by
Brown Henry E
Purchase Details
Closed on
May 1, 1985
Create a Home Valuation Report for This Property
The Home Valuation Report is an in-depth analysis detailing your home's value as well as a comparison with similar homes in the area
Home Values in the Area
Average Home Value in this Area
Purchase History
| Date | Buyer | Sale Price | Title Company |
|---|---|---|---|
| Quinn John F | -- | None Available | |
| Mayes Ferlando | $102,900 | -- | |
| Quinn John F | -- | -- | |
| Quinn John F | $114,900 | -- | |
| Turnkey 2000 Ltd | $65,000 | -- | |
| Brown Henry E | -- | -- | |
| -- | -- | -- |
Source: Public Records
Mortgage History
| Date | Status | Borrower | Loan Amount |
|---|---|---|---|
| Closed | Mayes Ferlando | $92,900 |
Source: Public Records
Tax History
| Year | Tax Paid | Tax Assessment Tax Assessment Total Assessment is a certain percentage of the fair market value that is determined by local assessors to be the total taxable value of land and additions on the property. | Land | Improvement |
|---|---|---|---|---|
| 2025 | $3,046 | $45,510 | $15,650 | $29,860 |
| 2024 | $3,046 | $45,510 | $15,650 | $29,860 |
| 2023 | $2,291 | $50,610 | $15,645 | $34,965 |
| 2022 | $1,064 | $15,750 | $5,460 | $10,290 |
| 2021 | $838 | $15,750 | $5,460 | $10,290 |
| 2020 | $1,051 | $19,710 | $5,460 | $14,250 |
| 2019 | $980 | $15,760 | $4,380 | $11,380 |
| 2018 | $1,136 | $15,760 | $4,380 | $11,380 |
| 2017 | $1,307 | $19,780 | $4,380 | $15,400 |
| 2016 | $1,384 | $20,370 | $4,270 | $16,100 |
| 2015 | $1,260 | $20,370 | $4,270 | $16,100 |
| 2014 | $1,263 | $20,370 | $4,270 | $16,100 |
| 2013 | $733 | $23,975 | $5,040 | $18,935 |
Source: Public Records
Map
Nearby Homes
- 1144 Arkwood Ave
- 931 E Fulton St
- 1001 Beechwood Rd
- 3955 E Fulton St
- 1265 Elderwood Ave
- 1294 Dellwood Ave
- 3990 Astor Ave
- 3598 Astor Ave
- 1275 Elaine Rd
- 1559 Vilardo Ln
- 1291 Westphal Ave
- 963 Erickson Ave
- 892 Ruby Ave
- 1490 Elaine Rd Unit 1462
- 1619 Basil Dr
- 1301 Bernhard Rd
- 822 Ruby Ave
- 849 Ruby Ave
- 1469 Burlington Ave
- 798 S Yearling Rd
- 1151 Beechwood Rd
- 3813 Astor Ave
- 1157 Beechwood Rd
- 1138 Arkwood Ave
- 3799 Astor Ave
- 1163 Beechwood Rd
- 1150 Arkwood Ave
- 3814 Astor Ave
- 1148 Beechwood Rd
- 3839 Astor Ave
- 1154 Beechwood Rd
- 1158 Arkwood Ave
- 1171 Beechwood Rd
- 3834 Bolton Ave
- 3802 Astor Ave
- 1113 Beechwood Rd
- 1164 Arkwood Ave
- 3798 Astor Ave
- 3840 Astor Ave
- 1177 Beechwood Rd