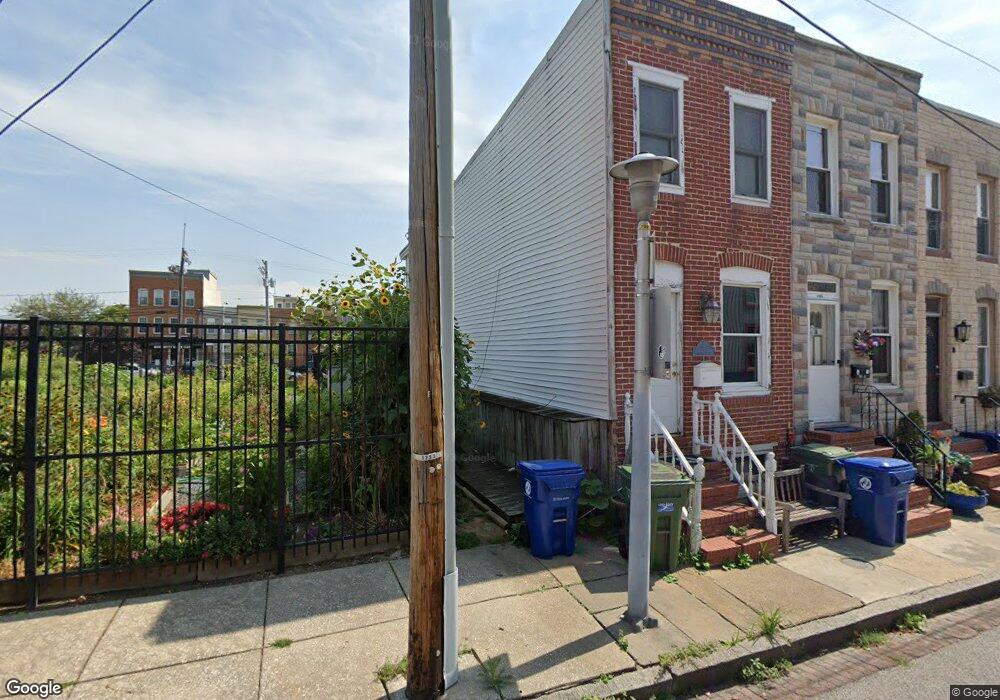
1143 Haubert St Baltimore, MD 21230
Locust Point NeighborhoodEstimated Value: $261,000 - $262,538
2
Beds
3
Baths
836
Sq Ft
$313/Sq Ft
Est. Value
About This Home
This home is located at 1143 Haubert St, Baltimore, MD 21230 and is currently estimated at $261,769, approximately $313 per square foot. 1143 Haubert St is a home located in Baltimore City with nearby schools including Francis Scott Key Elementary/Middle School, Booker T. Washington Middle School, and Digital Harbor High School.
Ownership History
Date
Name
Owned For
Owner Type
Purchase Details
Closed on
Sep 22, 2011
Sold by
First Horizon Home Loans
Bought by
Middleton William and Middleton Elaine
Current Estimated Value
Home Financials for this Owner
Home Financials are based on the most recent Mortgage that was taken out on this home.
Original Mortgage
$118,069
Outstanding Balance
$80,814
Interest Rate
4.25%
Mortgage Type
FHA
Estimated Equity
$180,955
Purchase Details
Closed on
Dec 1, 2010
Sold by
Boyko Craig W
Bought by
First Horizon Home Loans
Purchase Details
Closed on
Sep 28, 2005
Sold by
Cary Joseph A
Bought by
Boyko Craig W
Purchase Details
Closed on
Sep 11, 2003
Sold by
Conrad Lamar J
Bought by
Cary Joseph A and Cary Deborah S
Purchase Details
Closed on
Jun 7, 2001
Sold by
T J Associates
Bought by
Conrad Lamar J
Purchase Details
Closed on
Aug 25, 1999
Sold by
Wieland Frederic G
Bought by
T J Associates
Create a Home Valuation Report for This Property
The Home Valuation Report is an in-depth analysis detailing your home's value as well as a comparison with similar homes in the area
Home Values in the Area
Average Home Value in this Area
Purchase History
| Date | Buyer | Sale Price | Title Company |
|---|---|---|---|
| Middleton William | $124,900 | -- | |
| Middleton William | $124,900 | -- | |
| First Horizon Home Loans | $152,150 | None Available | |
| Boyko Craig W | $226,000 | -- | |
| Cary Joseph A | $185,900 | -- | |
| Conrad Lamar J | $62,000 | -- | |
| T J Associates | $33,500 | -- |
Source: Public Records
Mortgage History
| Date | Status | Borrower | Loan Amount |
|---|---|---|---|
| Open | Middleton William | $118,069 | |
| Closed | Middleton William | $7,500 | |
| Closed | Middleton William | $118,069 |
Source: Public Records
Tax History
| Year | Tax Paid | Tax Assessment Tax Assessment Total Assessment is a certain percentage of the fair market value that is determined by local assessors to be the total taxable value of land and additions on the property. | Land | Improvement |
|---|---|---|---|---|
| 2025 | $4,263 | $203,600 | -- | -- |
| 2024 | $4,263 | $196,000 | -- | -- |
| 2023 | $4,446 | $188,400 | $80,000 | $108,400 |
| 2022 | $4,103 | $186,567 | $0 | $0 |
| 2021 | $4,360 | $184,733 | $0 | $0 |
| 2020 | $4,025 | $182,900 | $80,000 | $102,900 |
| 2019 | $3,993 | $182,400 | $0 | $0 |
| 2018 | $3,939 | $181,900 | $0 | $0 |
| 2017 | $3,821 | $181,400 | $0 | $0 |
| 2016 | $5,393 | $171,533 | $0 | $0 |
| 2015 | $5,393 | $173,333 | $0 | $0 |
| 2014 | $5,393 | $151,800 | $0 | $0 |
Source: Public Records
Map
Nearby Homes
- 1143 Hull St
- 1212 Towson St
- 1312 Haubert St
- 1314 Haubert St
- 1324 Haubert St
- 1358 Towson St
- 1425 E Clement St
- 1327 Richardson St
- 1337 Richardson St
- 1413 Cooksie St
- 1432 Haubert St
- 1200 Steuart St Unit 713
- 1200 Steuart St Unit 425
- 1200 Steuart St Unit 312
- 1200 Steuart St Unit 1913
- 1200 Steuart St
- 1436 Andre St
- 1419 Andre St
- 1446 Andre St
- 1500 Latrobe Park Terrace
Your Personal Tour Guide
Ask me questions while you tour the home.